We want to support you in the best possible way while you take the first steps with PRTG. Once it is set up correctly, you will benefit from it every day. Please note that you might get a lot of notifications and alerts when you start your PRTG experience. But don’t worry – we’ll help you configure thresholds and notification triggers they way you need them.
Get a first overview of what PRTG can do
Learn more about configuring PRTG
Find out how to navigate the device tree
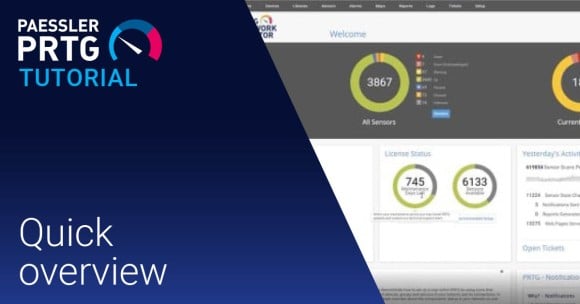
Get a first introduction to PRTG, including device tree settings, the alerting and reporting system, the PRTG map editor, or different user interfaces
We recommend that you run the central PRTG server directly on x64 server hardware or in a properly configured virtual environment.
Maps and dashboards, alerts and notifications, customizable reporting, or distributed monitoring – PRTG comes with all the features you need for comprehensive monitoring.
Find out about what a PRTG core server or a probe is and what tasks they perform, or which user interfaces you can use to view and manage your monitoring data.
Read more in the PRTG Manual: Architecture and User Interfaces
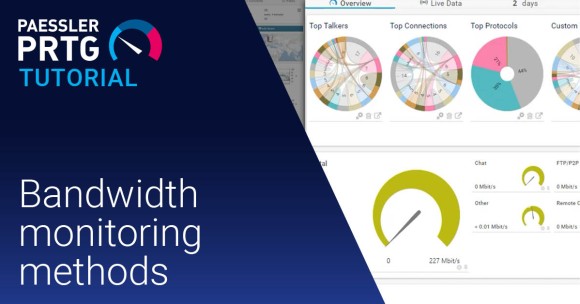
To get you started, see a short introduction on bandwidth monitoring with SNMP and WMI: Watch the video
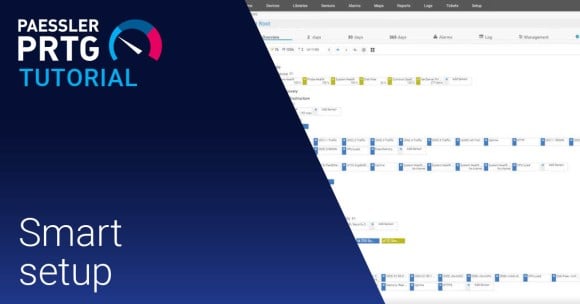
After you logged in to PRTG for the first time, you start with the smart setup. Our setup assistant guides you through your firs steps with PRTG.
Read more in the PRTG Manual: Step 2: Smart Setup
With PRTG’s granular access rights management, you can define which user in which user group can access which objects in your PRTG installation.
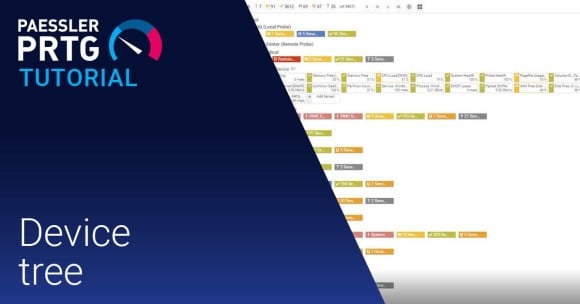
The device tree is the main structure with which to navigate through your monitoring setup. You can use it to drill down to the sensor settings level or to directly add new sensors to a device.
Read more in the PRTG Manual: Manage Device Tree
Watch video: How to edit the device tree
How-to guide: How to manually set up your device tree in 3 easy steps


PRTG uses notifications to send you alerts whenever it discovers a defined status or when channels breach threshold values. You can define an unlimited number of notification templates for different escalation levels, including notification contacts and notification methods such as email, SMS, or push notification.
Find out how to set up notifications and threshold values
Learn how to define threshold values, or sensor limits
See how to reduce alert noise with dependencies
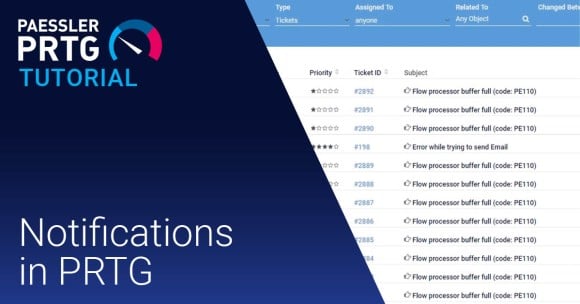
PRTG monitors your network 24/7/365. This does not mean, however, that you need to constantly check the PRTG web interface for new warnings or alarms. Here, notifications come into play. Set up notifications and notification triggers so that PRTG informs you about issues that are really important for your monitoring.
To get you started with notifications, see a short introduction and a step-by-step guide here:

Sensor limits enable you to set threshold values for almost any data that PRTG collects. They then trigger notifications if the given threshold values are breached. This way, PRTG can alerts you to an impending issue in time.

You are not really sure what use you have for different notification methods? We’ll help you collect some ideas.
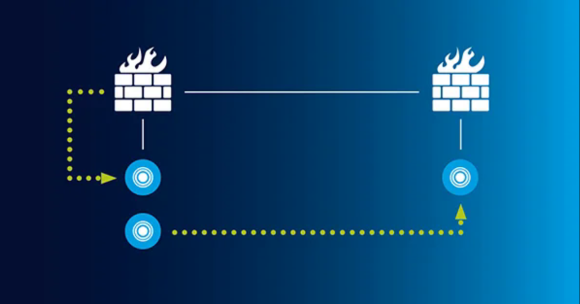
Using dependencies in PRTG to effectively monitor a VPN connection to receive as few notifications as possible only takes a few steps.
How-to guide: How to set up dependencies in PRTG – a scenario
PRTG is a powerful, affordable, and easy-to-use network monitoring solution. This page gives you an overview of everything you can monitor with it, from firewalls, ports, and servers, to LAN and network traffic monitoring, as well as distributed monitoring, and much more.
Learn which sensors are available for PRTG
Find out about custom sensors and scripts
Create your own dashboards and maps
We offer more than 250 sensor types for monitoring your entire infrastructure out-of-the-box for you, using the most common monitoring technologies and covering the most important vendors and manufacturers.
See the PRTG Manual: Available Sensor Types
Additionally, we have many custom and script sensor types available for your individual monitoring needs.
Find out more in the PRTG Sensor Hub
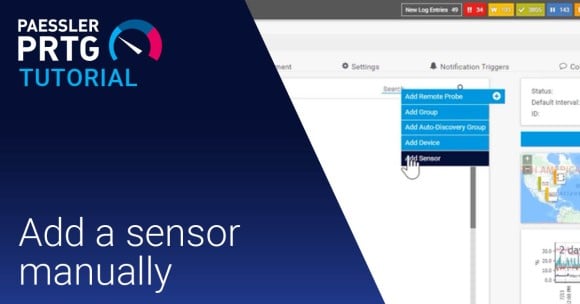
Adding devices and sensors to your monitoring setup is very intuitive. There are different methods you can use.
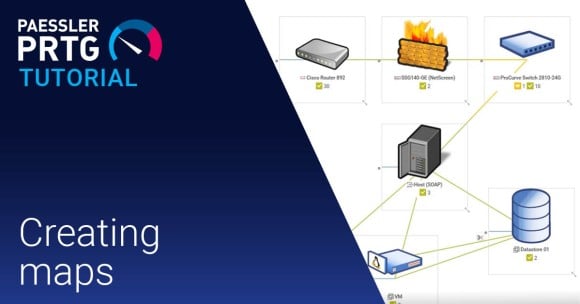
Maps (or dashboards) in PRTG not only show devices and connections, but also deliver status information. Detect problems at a glance and troubleshoot network issues effectively.

Practical step-by-step guides for various use cases of PRTG.

In our training courses, you'll learn how to work with PRTG.

All details regarding PRTG, its setup, configuration, and advanced topics.

Here you can find answers to the most common questions about PRTG.

Questions and answers by our user community about PRTG and network monitoring.

Free live webinars that offer you deep-dive sessions into various topics.

We are here to help you! Our experts will assist you with anything you need.

Free video tutorials that help you with monitoring your network with PRTG

Free scripts, plugins, and add-ons for PRTG by our user community.

Discover companies like yours who found success with PRTG.
Definitions and explanations of IT terms and concepts.

Fresh content about the IT, OT, and IIoT world – and PRTG.
Our Customer Service team will assist you with anything you need.
If you prefer talking to someone, just call us directly at +49 911 93775-400 (Mon-Fri 09.00-17.00 CET)