• Company
    • About Us
    • Case Studies
    • Press Center
    • Events
    • Careers
    • Blog
    • Contact us
  • Contact us
  • Login
 
  • English
    • Deutsch
    • Español
    • Français
    • Italiano
    • Português
Paessler
                    - The Monitoring Experts
  • Products
    • Paessler PRTG
      Paessler PRTGMonitor your whole IT infrastructure
      • PRTG Network Monitor
      • PRTG Enterprise Monitor
      • PRTG Hosted Monitor
      • PRTG extensionsExtensions for Paessler PRTGExtend your monitoring to a new level
    • Icon Features
      FeaturesExplore all monitoring features
      • Maps & dashboards
      • Alerts & notifications
      • Multiple user interfaces
      • Distributed monitoring
      • Customizable reporting
  • Solutions
    • Industries
      IndustriesMonitor various industry sectors
      • Industrial
      • Healthcare
      • Data Center
      • Education
      • Finance
      • Government
    • IT Topics
      IT TopicsMonitor all areas of IT
      • Network Monitoring
      • Bandwidth Monitoring
      • SNMP Monitor
      • Network Mapping
      • WiFi Monitoring
      • Server Monitoring
  • Pricing
  • Resources
    • Getting Started
      Getting StartedModules for self-paced learning
    • How-to Guides
      How-to GuidesGet the most out of PRTG
    • Videos & Webinars
      Videos & WebinarsLearn from Paessler experts
    • IT  Knowledge
      IT KnowledgeExpand your IT knowledge
    • PRTG Manual
      PRTG ManualFull documentation
    • Knowledge Base
      Knowledge BaseShare community knowledge
    • PRTG Sensor Hub
      PRTG Sensor HubGet sensors, scripts & templates
    • Trainings
      PRTG TrainingLearn how to work with PRTG
  • Partners
    • icon star
      New Partners and MSPBecome a new partner or MSP
    • icon partner
      Partner PortalLog in to your partner account
    • Deal Registration
      Deal RegistrationRegister your sales opportunities
    • icon search
      Find a PartnerFind partners selling Paessler products
    • icon technology
      Technology AlliancesSee Paessler technology partnerships
  • Company
    • About Us
    • Case Studies
    • Press Center
    • Events
    • Careers
    • Blog
    • Contact us
  • Contact us
  • Login
  • English
    • Deutsch
    • Español
    • Français
    • Italiano
    • Português
  • Get a quote
  • Free trial
  1. Home>
  2. Resources>
  3. How-to Guides>
  4. How to create dashboards in PRTG with the Maps feature in 5 steps
PRTG Logo

How to create dashboards in PRTG with the Maps feature in 5 steps

Free download
product overview

Creating dashboards in PRTG with the Maps feature: Step-by-Step Guide

Table of content
  • Add a map
  • Add map items
  • View and share the map
  • Add the map to the Home menu
  • Rotate several maps

What’s the benefit of the Maps feature?

  • Maps in PRTG are what most people call dashboards. Create custom dashboards as HTML web pages that visualize your monitoring information the way you want.
  • Use visual elements like sensor status icons, data tables, graphs, geographical maps, sunbursts, custom images, and more.
  • Show your maps on large screens in offices, datacenters, factory floors, or wherever you like.
  • Publish your maps internally for colleagues or the management.

Bring your monitoring experience to the next level with PRTG

Get full visibility with real-time dashboards, alerts, and customizable sensors

Free download
PRODUCT OVERVIEW

Add a map

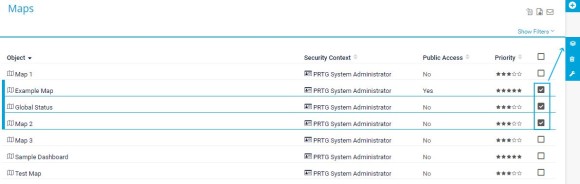
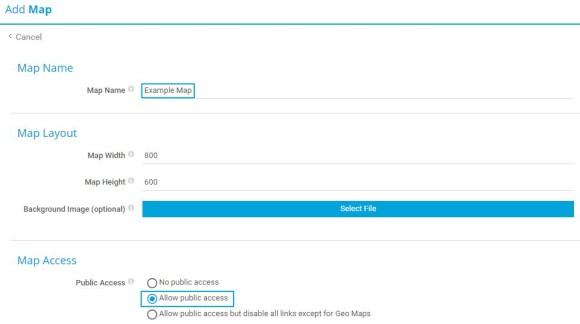
First, you need to create a new map. Take the following steps: 

  1. Select Maps | Add Map from the main menu to open the Add Map
  2. Enter a meaningful Map Name.
  3. Enter the Map Width and the Map Height in pixels. Optionally, you can upload a background image.
  4. In the Map Access section, define the accessibility to your map. If you select Allow public access, you can find a Secret Key on the map’s Settings tab after you created the map. You need this key to publish the map.
  5. Click Create
PRTG Screenshot add map

Add map items

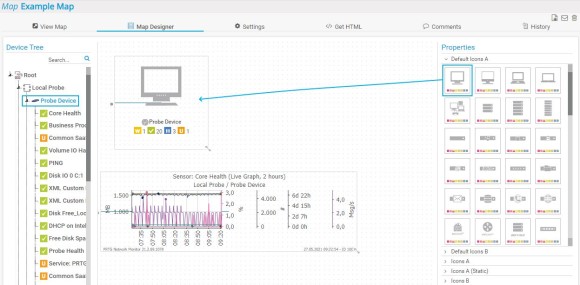
Because the new map is empty in the beginning, you need to add map items to fill the map with content. Take the following steps: 

  1. When you create a new map, the Map Designer tab opens.
  2. Select an object from the Device Tree section on the left.
  3. Drag and drop an object from the Properties section on the right onto the map design area in the middle.
  4. Select the new map item to edit its attributes in the Properties section on the right.
  5. Click Save.

Repeat this procedure as often as you wish until you added all desired items to the map. Drag items to change their position. You can also draw connection lines between items.

PRTG Screenshot example map

View and share the map

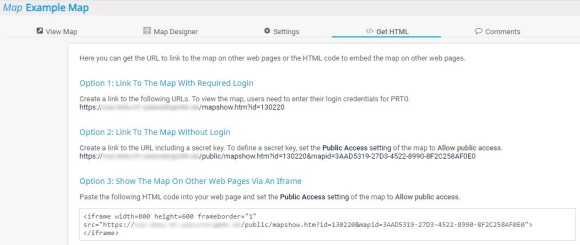
You can always preview or publish your map. Do the following: 

  1. Click the View Map tab to show your map.
  2. Click different object names to get more detailed information. It depends on the access rights of an object and the logged in user account if a user can get more detailed information about the object.
  3. Click the Get HTML tab to get a direct URL of your map that you can share with others. Choose from 3 options to share your new map.
PRTG Screenshot example map

PRTG makes monitoring as easy as it gets

Custom alerts and data visualization let you quickly identify and prevent all kinds of issues

Free download
PRODUCT OVERVIEW

Add the map to the Home menu

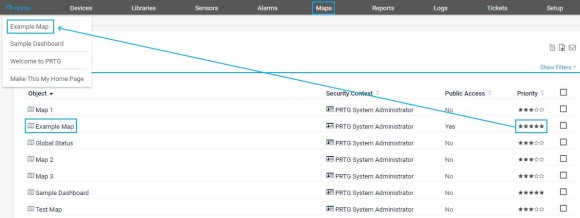
To quickly access a map, you can add it to the Home menu as well. Take the following steps: 

  1. Select Maps from the main menu to open an overview list of all your maps.
  2. Find the map that you want to add to the Home
  3. In the Priority column, select ***** for the map. The map appears in the Home menu after a page refresh.
PRTG Screenshot add example map to home menu

Rotate several maps

Like a slide show, you can rotate between several maps on one page. Take the following steps to set up the map rotation: 

  1. Select Maps from the main menu to open an overview list of all your maps.
  2. Enable the check box next to the maps that you want to rotate.
  3. Click the stack icon in the multi-edit menu that appears.
  4. PRTG now rotates the maps on a new page. To change the rotation interval, hover over the reload icon in the lower right corner of this page and select a different interval.
PRTG Screenshot rotate between maps

This how-to guide only scratches the surface?

Get more deep-dive information here!

Preview Video

A brief overview of the PRTG map functionality

View more
Preview webinar

Webinar: Getting started with notifications

View more
Preview manual

All about maps in our PRTG Manual

READ more
PRTG Logo

Start monitoring your IT infrastructure for free with PRTG and see how it can make your network more reliable and your job easier.

Free download
PRODUCT OVERVIEW

Products

  • Paessler PRTG
    Paessler PRTGMonitor your whole IT infrastructure
    • PRTG Network Monitor
    • PRTG Enterprise Monitor
    • PRTG Hosted Monitor
    • PRTG extensions
      Extensions for Paessler PRTGExtend your monitoring to a new level
  • Icon Features
    FeaturesExplore all monitoring features

Monitoring with PRTG

  • Network monitoring
  • Bandwidth monitoring
  • SNMP monitoring
  • Network mapping
  • Wi-Fi monitoring
  • Server monitoring
  • Network traffic analyzer
  • NetFlow monitoring
  • Syslog server

Useful Links

  • PRTG Manual
  • Knowledge Base
  • Customer Success Stories
  • About Paessler
  • Subscribe to newsletter
  • PRTG Support
  • PRTG Consulting
  • PRTG Feedback & Roadmap

Contact

Paessler GmbH
Thurn-und-Taxis-Str. 14, 
90411 Nuremberg 
Germany

[email protected]

+49 911 93775-0

  • Contact us
©2025 Paessler GmbHTerms & ConditionsPrivacy PolicyImprintReport VulnerabilityDownload & InstallSitemap
Application Performance Monitoring Tool Application Performance Monitoring Tool Application Performance Monitoring Tool