• Company
    • About Us
    • Case Studies
    • Press Center
    • Events
    • Careers
    • Blog
    • Contact us
  • Contact us
  • Login
 
  • English
    • Deutsch
    • Español
    • Français
    • Italiano
    • Português
Paessler
                    - The Monitoring Experts
  • Products
    • Paessler PRTG
      Paessler PRTGMonitor your whole IT infrastructure
      • PRTG Network Monitor
      • PRTG Enterprise Monitor
      • PRTG Hosted Monitor
      • PRTG extensionsExtensions for Paessler PRTGExtend your monitoring to a new level
    • Icon Features
      FeaturesExplore all monitoring features
      • Maps & dashboards
      • Alerts & notifications
      • Multiple user interfaces
      • Distributed monitoring
      • Customizable reporting
  • Solutions
    • Industries
      IndustriesMonitor various industry sectors
      • Industrial
      • Healthcare
      • Data Center
      • Education
      • Finance
      • Government
    • IT Topics
      IT TopicsMonitor all areas of IT
      • Network Monitoring
      • Bandwidth Monitoring
      • SNMP Monitor
      • Network Mapping
      • WiFi Monitoring
      • Server Monitoring
  • Pricing
  • Resources
    • Getting Started
      Getting StartedModules for self-paced learning
    • How-to Guides
      How-to GuidesGet the most out of PRTG
    • Videos & Webinars
      Videos & WebinarsLearn from Paessler experts
    • IT  Knowledge
      IT KnowledgeExpand your IT knowledge
    • PRTG Manual
      PRTG ManualFull documentation
    • Knowledge Base
      Knowledge BaseShare community knowledge
    • PRTG Sensor Hub
      PRTG Sensor HubGet sensors, scripts & templates
    • Trainings
      PRTG TrainingLearn how to work with PRTG
  • Partners
    • icon star
      New Partners and MSPBecome a new partner or MSP
    • icon partner
      Partner PortalLog in to your partner account
    • Deal Registration
      Deal RegistrationRegister your sales opportunities
    • icon search
      Find a PartnerFind partners selling Paessler products
    • icon technology
      Technology AlliancesSee Paessler technology partnerships
  • Company
    • About Us
    • Case Studies
    • Press Center
    • Events
    • Careers
    • Blog
    • Contact us
  • Contact us
  • Login
  • English
    • Deutsch
    • Español
    • Français
    • Italiano
    • Português
  • Get a quote
  • Free trial
  1. Home>
  2. Resources>
  3. How-to Guides>
  4. How to manually set up your device tree in 3 easy steps
PRTG Logo

How to manually set up your device tree in 3 easy steps

Free download
product overview

Setting up your device tree with PRTG: Step-by-Step Guide

Table of content
  • Make a plan
  • Realize your plans in PRTG
  • Start monitoring

As a system administrator, you want to monitor all your devices, but you want to build up your own device tree in PRTG instead of using the auto-discovery? Then you have come to the right place.

This how-to guide will give you all the important information that you need to create your very own device tree from scratch.

Make a plan

Before you install and run PRTG, think about the IT infrastructure that you want to monitor. Ask yourself questions like the following:

Where are your devices or applications located?

In the same network as your PRTG installation or in other local networks? Are they on-site, in a branch office in another city or country, or on another continent? Draw a map. This will help you to decide how many probes you need and how many remote probes will be part of your device tree.

Do you have devices or applications that share the same configuration or settings?

For example, do parts of your network use the same SNMP credentials or do bundles of applications need a certain Active Directory account? Think about how many and which groups you could create in the device tree to inherit configuration or settings information to all dependent monitored items.

Who is responsible for what
in your IT team?

Who do you have to grant access to certain locations, parts of networks, devices, or applications? This will help you to define dedicated groups to which you can assign according access rights that are inherited to all dependent monitored items.

Bring your monitoring experience to the next level with PRTG

Get full visibility with real-time dashboards, alerts, and customizable sensors

Free download
PRODUCT OVERVIEW

Realize your plans in PRTG

With a sound plan at your hand, you can now proceed to setting up your device tree:

icon click

Download and install PRTG Network Monitor and disable the auto-discovery

icon sensor

PRTG automatically installs a probe for your local network, the local probe.

info location

For every remote location or independent local area network, install a remote probe.

If you have come to this point, you have a basic device tree with 2 hierarchy levels:

icon number one

Root group level

The default root group level, the highest level in the object hierarchy of the device tree

icon number two

Probe level

The probe level, with at least the local probe, and with remote probes you installed

PRTG makes monitoring as easy as it gets

Custom alerts and data visualization let you quickly identify and prevent all kinds of issues

Free download
PRODUCT OVERVIEW

Now add the third level: the groups 

You have two options to add groups and the subobjects of a group in the device tree (further subgroups, devices, and sensors):

Option 1:

Add your groups and all subobjects completely manually. After adding your groups, you also have to manually add devices, before adding the sensors you need.

Option 2:

Partially automate the creation of groups and subobjects by adding auto-discovery groups. Specify IPs or IP ranges and necessary credentials for the auto-discovery, and PRTG automatically adds devices with suitable sensors, if found. If you want to customize the auto-discovery, first check out how the auto-discovery works.

Always remember that the device tree in PRTG has a hierarchical structure that implies the inheritance
of properties from objects that are higher in the hierarchy to objects that are lower in the hierarchy.

Do not forget to set up notifications and notification triggers to always be alerted if there are any issues.

Tip: Check out the various graphical representations of the device tree!

Start monitoring


Whenever your network changes and new devices or applications are added, just repeat the steps described in this article.

If you want to completely automate scanning for new devices and setting up your monitoring, you can define a regular schedule for auto-discoveries. For example, scan your network, or parts of it, every week or every few weeks, day or night, during weekdays or on the weekend, just like your resources allow it.

Two examples of structuring a device tree

Example 1

PRTG Screenshot device tree ESXI VMware


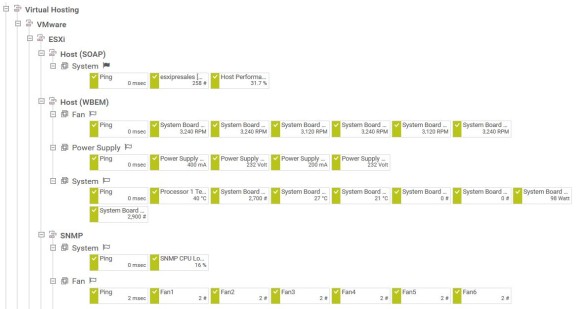
This is an example device tree part that reflects the monitoring of virtual ESXi hosts.

PRTG Screenshot credentials for VMware/XenServer

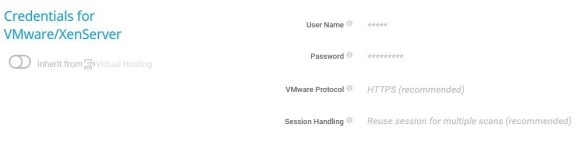
The ESXi group is a subgroup of VMware and Virtual Hosting and inherits the VMware credentials from the VMware group.

PRTG screenshot SNMP Compatibility options

The ESXi group has several subgroups that are organized according to the used technology: SOAP, WBEM, and SNMP.

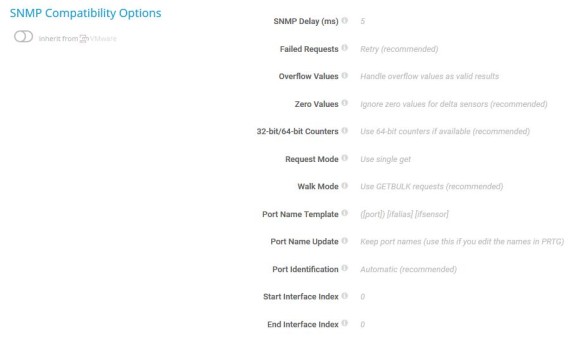
All these subgroups inherit SNMP credentials and SNMP compatibility options from the ESXi group, because SNMP sensors are not only used in the SNMP subgroup, but potentially also in the WBEM and SOAP subgroups.

Example 2

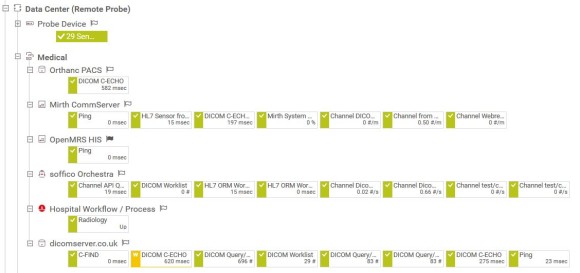
In the following example, the Medical group comprises various monitoring technologies from different vendors of the healthcare sector.

Because the Medical group has independent system administrators in charge, it is a quite independent group in the device tree. Settings like Credentials for Windows Systems, Credentials for Linux/Solaris/MacOS (SSH/WBEM) Systems, Credentials for VMware/XenServer, Credentials for SNMP Devices, Credentials for Database Management Systems, and Credentials for AWS are inherited to all devices directly from the Medical group without any subgroups in between.

The possibilities to build your own device tree with PRTG are unlimited. All you have to do is think in advance about how your device tree will best fit the structure of your company and how it can make your work easier.

PRTG Screenshot Device Tree of a data center

This how-to guide only scratches the surface?

Get more deep-dive information here!

Preview Video

A video about editing your device tree

View more
Preview Knowledge Base

In our Knowledge Base, the community talks about their device trees

READ more
Preview Manual

Our Manual describes the setup of a device tree in detail

REad more
PRTG Logo

Start monitoring your IT infrastructure for free with PRTG and see how it can make your network more reliable and your job easier.

Free download
PRODUCT OVERVIEW

Products

  • Paessler PRTG
    Paessler PRTGMonitor your whole IT infrastructure
    • PRTG Network Monitor
    • PRTG Enterprise Monitor
    • PRTG Hosted Monitor
    • PRTG extensions
      Extensions for Paessler PRTGExtend your monitoring to a new level
  • Icon Features
    FeaturesExplore all monitoring features

Monitoring with PRTG

  • Network monitoring
  • Bandwidth monitoring
  • SNMP monitoring
  • Network mapping
  • Wi-Fi monitoring
  • Server monitoring
  • Network traffic analyzer
  • NetFlow monitoring
  • Syslog server

Useful Links

  • PRTG Manual
  • Knowledge Base
  • Customer Success Stories
  • About Paessler
  • Subscribe to newsletter
  • PRTG Support
  • PRTG Consulting
  • PRTG Feedback & Roadmap

Contact

Paessler GmbH
Thurn-und-Taxis-Str. 14, 
90411 Nuremberg 
Germany

[email protected]

+49 911 93775-0

  • Contact us
©2025 Paessler GmbHTerms & ConditionsPrivacy PolicyImprintReport VulnerabilityDownload & InstallSitemap
Application Performance Monitoring Tool Application Performance Monitoring Tool Application Performance Monitoring Tool