• Company
    • About Us
    • Case Studies
    • Press Center
    • Events
    • Careers
    • Blog
    • Contact us
  • Contact us
  • Login
 
  • English
    • Deutsch
    • Español
    • Français
    • Italiano
    • Português
Paessler
                    - The Monitoring Experts
  • Products
    • Paessler PRTG
      Paessler PRTGMonitor your whole IT infrastructure
      • PRTG Network Monitor
      • PRTG Enterprise Monitor
      • PRTG Hosted Monitor
      • PRTG extensionsExtensions for Paessler PRTGExtend your monitoring to a new level
    • Icon Features
      FeaturesExplore all monitoring features
      • Maps & dashboards
      • Alerts & notifications
      • Multiple user interfaces
      • Distributed monitoring
      • Customizable reporting
  • Solutions
    • Industries
      IndustriesMonitor various industry sectors
      • Industrial
      • Healthcare
      • Data Center
      • Education
      • Finance
      • Government
    • IT Topics
      IT TopicsMonitor all areas of IT
      • Network Monitoring
      • Bandwidth Monitoring
      • SNMP Monitor
      • Network Mapping
      • WiFi Monitoring
      • Server Monitoring
  • Pricing
  • Resources
    • Getting Started
      Getting StartedModules for self-paced learning
    • How-to Guides
      How-to GuidesGet the most out of PRTG
    • Videos & Webinars
      Videos & WebinarsLearn from Paessler experts
    • IT  Knowledge
      IT KnowledgeExpand your IT knowledge
    • PRTG Manual
      PRTG ManualFull documentation
    • Knowledge Base
      Knowledge BaseShare community knowledge
    • PRTG Sensor Hub
      PRTG Sensor HubGet sensors, scripts & templates
    • Trainings
      PRTG TrainingLearn how to work with PRTG
  • Partners
    • icon star
      New Partners and MSPBecome a new partner or MSP
    • icon partner
      Partner PortalLog in to your partner account
    • Deal Registration
      Deal RegistrationRegister your sales opportunities
    • icon search
      Find a PartnerFind partners selling Paessler products
    • icon technology
      Technology AlliancesSee Paessler technology partnerships
  • Company
    • About Us
    • Case Studies
    • Press Center
    • Events
    • Careers
    • Blog
    • Contact us
  • Contact us
  • Login
  • English
    • Deutsch
    • Español
    • Français
    • Italiano
    • Português
  • Get a quote
  • Free trial
  1. Home>
  2. Resources>
  3. How-to Guides>
  4. How to set up scanning intervals of sensors in 3 steps
PRTG Logo

How to set up scanning intervals of sensors in 3 steps

Free download
product overview

Setting up scanning intervals in PRTG: Step-by-Step Guide

Table of content
  • What are scanning intervals?
  • Include sensors and set a report schedule
  • How to set up scanning intervals

Bring your monitoring experience to the next level with PRTG

Get full visibility with real-time dashboards, alerts, and customizable sensors

Free download
PRODUCT OVERVIEW

What are scanning intervals?

icon idea

Definition

A scanning interval is the amount of time that lies between two sensor scans

Fixed intervals

Certain sensors have fixed scanning intervals, for example the Common SaaS sensor. Changing fixed values of sensors is not possible.

Minimum intervals

There are also sensors that have a fixed minimum scanning interval for performance reasons. You cannot run these sensors in shorter intervals than this minimum interval.

Custom intervals

Other sensors have no specifications regarding scanning intervals. You can enter a scanning interval upon creation of the sensor. If you do not set one manually, the sensor will inherit the scanning interval defined in its parent object.

Include sensors and set a report schedule

icon time

Scanning intervals shorter than 30 seconds usually do not give you more accuracy but cause unnecessary load on your machine and the network. Therefore, avoid intervals below 30 seconds.

icon sensor

Use mainly 1-minute scanning intervals for up to 2,000 sensors and 5-minute scanning intervals if you have more sensors.

icon load balance

"David vs. Goliath" sensors with only minimum load vs. sensors that create a lot of load on your system:

  • Example David - Ping v2 Sensor: Ping requests only create minimal load so that you can choose a very short scanning interval without putting too much strain on your system.
  • Example Goliath - Windows Updates Status (PowerShell) Sensor:  The minimum scanning interval for this sensor is 1 hour, but we recommend that you set the scanning interval of this sensor to at least 12 hours to limit the load on the server being monitored.
icon factory

Factory Sensor: 

Ensure that the scanning interval of the Sensor Factory sensor is equal to or greater than the scanning interval of the source sensor(s) to avoid incorrect sensor behavior. For example, "no data" messages or erratic changes of the sensor status can be a result of a scanning interval that has not been set properly.

How to set up scanning intervals

Single sensors

Step 1

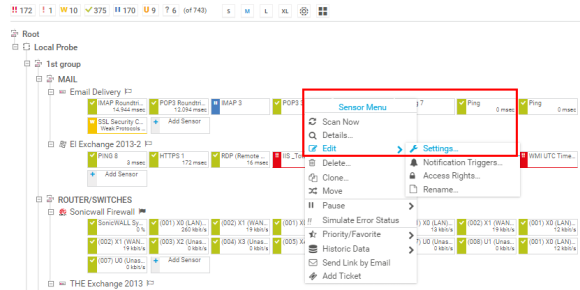
Right-click the desired sensor in the device tree and select Edit | Settings.


Step 2

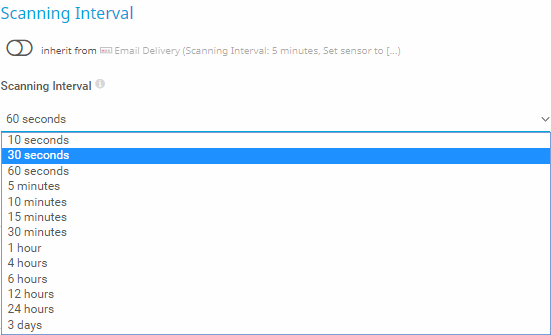
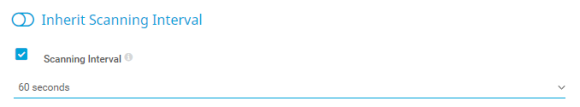
Scroll to section Scanning Interval and click the Scanning Interval dropdown menu. Pre-defined scanning intervals in PRTG are 30s (30 seconds), 1m (1 minute), 5m, 10m, 15m, 30m, 1h (1 hour), 4h, 6h, 12h, and 1d (1 day).

Please remember that the performance impact of a sensor is related to the scanning interval. Sensors with a high performance impact and a short scanning interval will notably slow down your machine!


Step 3

Select one of these scanning intervals OR enable Inherit from… to use the scanning interval from the parent object.


Step 4

Click OK to save your settings.

PRTG Screenshot sensor settings
Settings of the desired sensor
PRTG Screenshot sensor settings

Settings of the desired sensor

PRTG Screenshot scanning interval
Scanning intervals dropdown menu
PRTG Screenshot scanning interval

Scanning intervals dropdown menu

PRTG makes monitoring as easy as it gets

Custom alerts and data visualization let you quickly identify and prevent all kinds of issues

Free download
PRODUCT OVERVIEW

Multiple sensors

  1. From the PRTG main menu, select Sensors | By Type and select for example all Ping sensors.
  2. Click the multi-edit checkbox to select all sensors or only a set of sensors.
  3. Click the wrench symbol in the multi-edit menu on the right side.
  4. Scroll to Inherit Scanning Interval, select the Scanning Interval checkbox, and set the desired value to modify the scanning interval settings for all selected sensors.
  5. Click OK to save your settings.
PRTG Screenshot Ping sensors
PRTG Screenshot Inherit Scanning interval

Review your settings

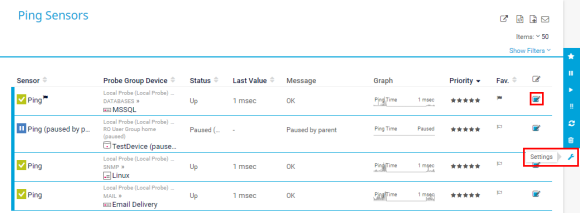
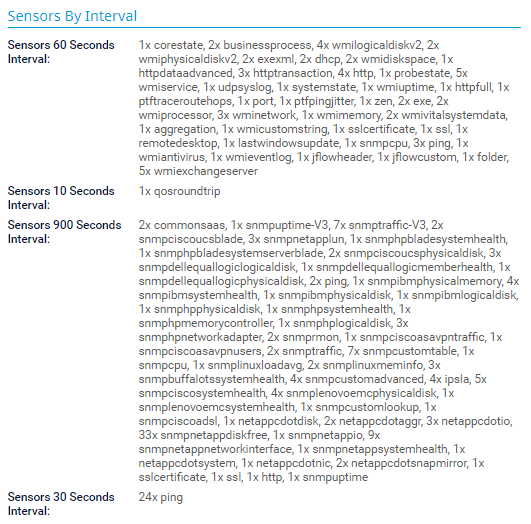
To get an overview of your scanning interval settings for your sensors, select Setup | PRTG Status from the PRTG main menu and click Sensors by Interval.

PRTG Screenshot system status

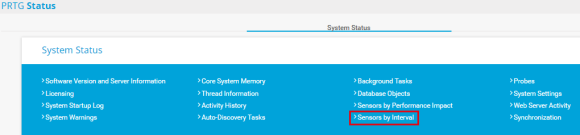
Here you can see which sensors of a certain type have which scanning interval (in seconds).

PRTG Screenshot sensors by interval

Want more? 
Create your own scanning intervals

icon number one

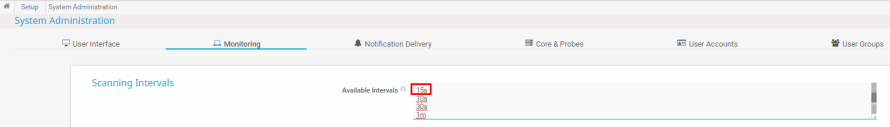
To create your own scanning intervals, select Setup | System Administration | Monitoring from the PRTG main menu.

icon number two

In section Scanning Intervals, enter your own scanning intervals in the dropdown list. For example, 2h for 2 hours.

icon number three

Click Save. Once you have saved, the customized scanning intervals will be available for selection.

PRTG Screenshot system administration - scanning intervals

This how-to guide only scratches the surface?

Get more deep-dive information here!

Preview video

Learn more about sensor states in our tutorial

view more
Preview Knowledge Base

In our Knowledge Base, you get information about scanning intervals as well 

Read more
Preview Manual

Our manual describes scanning intervals in detail 

READ more
PRTG Logo

Start monitoring your IT infrastructure for free with PRTG and see how it can make your network more reliable and your job easier.

Free download
PRODUCT OVERVIEW

Products

  • Paessler PRTG
    Paessler PRTGMonitor your whole IT infrastructure
    • PRTG Network Monitor
    • PRTG Enterprise Monitor
    • PRTG Hosted Monitor
    • PRTG extensions
      Extensions for Paessler PRTGExtend your monitoring to a new level
  • Icon Features
    FeaturesExplore all monitoring features

Monitoring with PRTG

  • Network monitoring
  • Bandwidth monitoring
  • SNMP monitoring
  • Network mapping
  • Wi-Fi monitoring
  • Server monitoring
  • Network traffic analyzer
  • NetFlow monitoring
  • Syslog server

Useful Links

  • PRTG Manual
  • Knowledge Base
  • Customer Success Stories
  • About Paessler
  • Subscribe to newsletter
  • PRTG Support
  • PRTG Consulting
  • PRTG Feedback & Roadmap

Contact

Paessler GmbH
Thurn-und-Taxis-Str. 14, 
90411 Nuremberg 
Germany

[email protected]

+49 911 93775-0

  • Contact us
©2025 Paessler GmbHTerms & ConditionsPrivacy PolicyImprintReport VulnerabilityDownload & InstallSitemap
Application Performance Monitoring Tool Application Performance Monitoring Tool Application Performance Monitoring Tool