Custom alerts and data visualization let you quickly identify and prevent CPU, memory and data store issues in vCenter.
Are you struggling to maintain visibility across your VMware environment? PRTG's vCenter monitoring capabilities allow you to track every aspect of your virtual infrastructure from a single dashboard. Get immediate insight into performance issues before they affect your users.
PRTG provides a centralized view of your entire VMware environment through customizable dashboards. You can arrange widgets to display the metrics that matter most to your specific needs. These dashboards give you instant visibility into the health of your virtual infrastructure at a glance.
PRTG comes with ready-to-use sensors specifically designed for VMware vCenter monitoring. You can deploy these sensors within minutes without complex configuration or scripting. These specialized sensors collect all critical metrics from your vCenter Server, ESXi hosts, and virtual machines.
PRTG automatically detects new virtual machines added to your vCenter environment. You don’t need to manually configure monitoring for newly deployed VMs in your infrastructure. This automation ensures complete monitoring coverage even as your virtual environment grows and changes.
PRTG notifies you immediately when performance thresholds are exceeded in your vCenter environment. You can customize notification methods including email, SMS, or push notifications to your mobile device. These timely alerts help you address issues before they impact your business operations.
Diagnose network issues by continuously tracking ESXi host health, virtual machine status and storage latency. Show resource pool utilization and other key metrics in real time. Visualize monitoring data in clear graphs and dashboards to identify problems more easily. Gain the overview you need to troubleshoot vMotion issues and performance degradation.

Device tree view of the complete monitoring setup

Custom PRTG dashboard for keeping an eye on the entire IT infrastructure

Live traffic data graph in PRTG
“All-around winning
network monitor”
“The real beauty of PRTG is the endless possibilities it offers”
“PRTG Network Monitor
is very hard to beat”
Managing a VMware environment can quickly become overwhelming when performance issues arise. Virtual machines might suddenly slow down, ESXi hosts can reach resource limits without warning, or data stores may run out of space during critical operations. When vCenter itself experiences problems, your entire virtual infrastructure becomes difficult to manage, potentially leading to significant downtime
Choose the subscription model that perfectly fits the size of your VMware infrastructure without overpaying. Scale your monitoring up or down as your virtual environment grows or changes throughout the year. Avoid complex licensing calculations with straightforward sensor-based pricing that makes budgeting simple.
Monitor your vCenter environment from anywhere using the PRTG mobile apps for iOS and Android. Receive push notifications about critical VMware issues directly to your smartphone, even when you're away from your desk. Troubleshoot virtual machine problems while on the move with full access to monitoring data at your fingertips.
Contact knowledgeable support specialists who understand both PRTG and VMware environments whenever you need assistance. Access comprehensive documentation specifically designed for vCenter monitoring setup and optimization. Benefit from regular software updates that enhance VMware monitoring capabilities as virtualization technologies evolve.
Deploy PRTG with minimal impact on your existing infrastructure and network performance. Monitor hundreds of virtual machines without creating additional load on your vCenter servers or ESXi hosts. Maintain efficient resource usage with optimized polling intervals that balance monitoring detail with system performance.
PRTG comes with more than 250 native sensor types for monitoring your entire on-premises, cloud, and hybrid cloud environment out of the box. Check out some examples below!
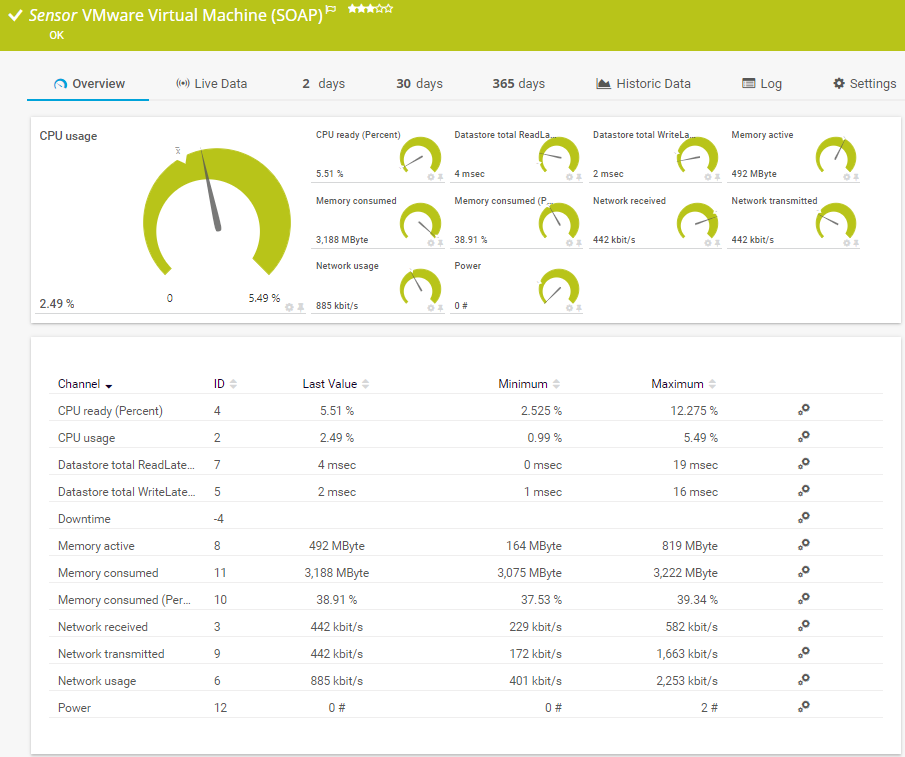
The VMware Virtual Machine (SOAP) sensor monitors a virtual machine (VM) on a VMware host server using the Simple Object Access Protocol (SOAP). It can show the following and more:
CPU readiness and usage
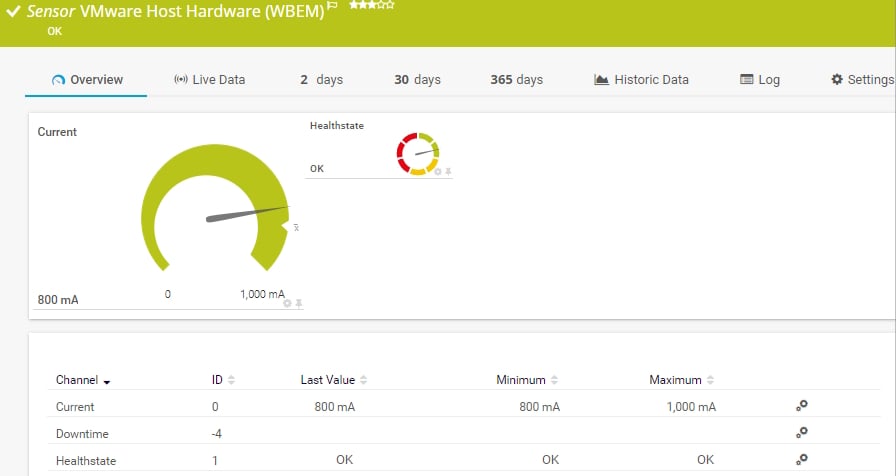
The VMware Host Hardware (WBEM) sensor monitors information about the hardware of an ESXi server using Web-based Enterprise Management (WBEM). It can show the following:
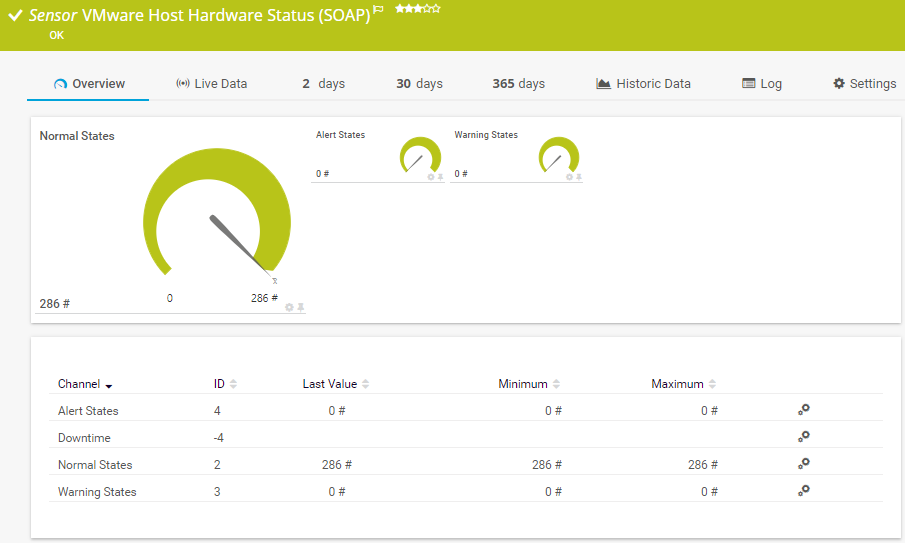
The VMware Host Hardware Status (SOAP) sensor monitors the hardware status of a VMware host server using the Simple Object Access Protocol (SOAP). It gives you a general status overview of the host. It can show the following:
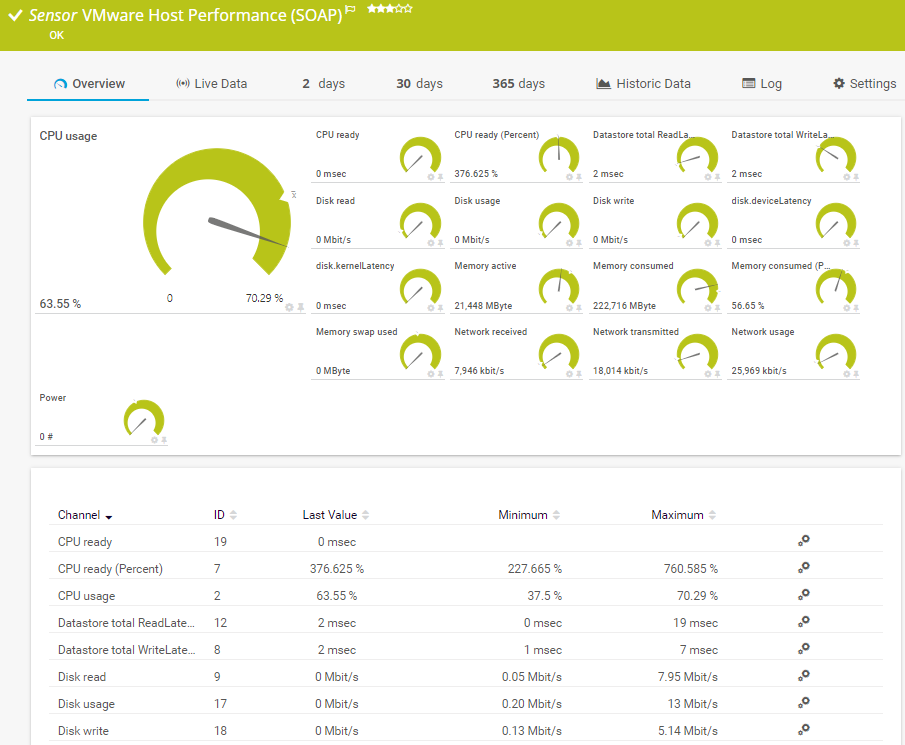
The VMware Host Performance (SOAP) sensor monitors a VMware host server using the Simple Object Access Protocol (SOAP). It can show the following and more:
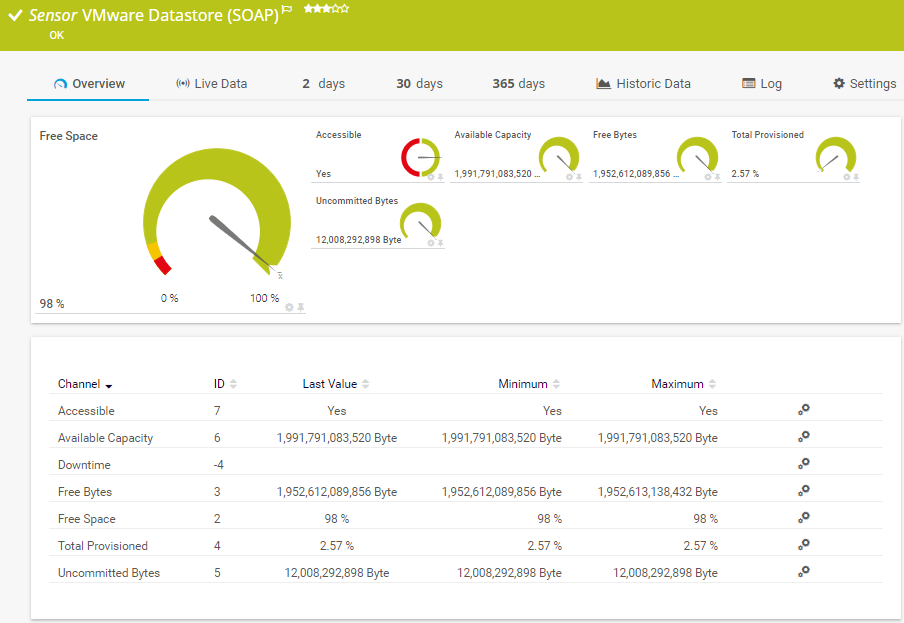
The VMware Datastore (SOAP) sensor monitors the disk usage of a VMware datastore using the Simple Object Access Protocol (SOAP). It can show the following:
See the PRTG Manual for a list of all available sensor types.

Custom alerts and data visualization let you quickly identify and prevent performance issues in your VMware environment
PRTG is set up in a matter of minutes and can be used on a wide variety of mobile devices.

Partnering with innovative IT vendors, Paessler unleashes synergies to create
new and additional benefits for joined customers.
Axis offers one of the most complete and reliable product portfolios, an expanded professional network, and comprehensive integration support for video management software.
Integrating monitoring results from PRTG into NetBrain maps makes the foundation for network automation.
Paessler and Plixer provide a complete solution adding flow and metadata analysis to a powerful network monitoring tool.
Real-time notifications mean faster troubleshooting so that you can act before more serious issues occur.
Network Monitoring Software – Version 25.3.110.1313 (August 27, 2025)
Download for Windows and cloud-based version PRTG Hosted Monitor available
English, German, Spanish, French, Portuguese, Dutch, Russian, Japanese, and Simplified Chinese
Network devices, bandwidth, servers, applications, virtual environments, remote systems, IoT, and more
Choose the PRTG Network Monitor subscription that's best for you
A vCenter monitoring tool tracks performance and health of VMware vCenter Server and its virtual infrastructure in your data center. These tools collect performance metrics from VMware environments, ESX/ESXi servers, hypervisors, and virtual machines running Windows or Linux. They provide dashboards showing resource allocation, CPU usage, and memory usage to help identify issues before they affect users. Effective vSphere performance monitoring tools connect to endpoints via SNMP, API, or direct connections from various providers to optimize your virtual environment.
PRTG provides comprehensive VMware monitoring through specialized sensors connecting to vCenter server via SOAP, API, and WBEM protocols. These track performance metrics across your virtual infrastructure, including host hardware, data stores, and virtual machines. PRTG automatically discovers compute resources and maintains monitoring even when VMs migrate between ESXi hosts through vMotion, ensuring continuous vSphere monitoring of your virtual environment.
With PRTG, you can monitor virtual machine performance metrics including CPU usage, memory allocation, disk latency, power state, and network traffic. You can track ESXi server performance, resource pools, file system usage, and hypervisor health through customizable dashboards. PRTG provides comprehensive capabilities for troubleshooting performance bottlenecks in your VMware environments through detailed latency analysis and virtual infrastructure monitoring.
To set up VMware monitoring, add your vCenter server as a device in PRTG using its device name or IP address and enter VMware credentials. Run auto-discovery to detect virtual machines and create sensors. PRTG offers monitoring templates to simplify configuration for different hypervisor types. For optimal performance, install PRTG on Microsoft Windows Server 2016 or later. You can also configure SNMP monitoring for additional components in your virtual infrastructure.
Yes, PRTG helps with capacity planning by providing reports on resource utilization trends in your virtual environment. Monitoring CPU allocation, memory usage, and data storage capacity allows you to identify when your infrastructure requires additional computing resources. PRTG's dashboards help visualize growth patterns of virtual machines, prevent bottlenecks, and optimize performance. You can also monitor configuration files and templates to track infrastructure changes.
PRTG provides flexible alerting options for VMware environments and virtual machines. Configure threshold-based notifications when performance metrics like CPU usage, memory consumption, or file system space exceed limits. Alerts can be delivered through email, SMS, push notifications, or API calls. This real-time vSphere monitoring helps administrators respond quickly to issues and supports effective troubleshooting before problems impact operations.
Yes, PRTG monitors both VMware virtual environments and physical infrastructure from a single dashboard. This approach correlates issues between virtualization layers, hypervisors, and underlying hardware. PRTG monitors network traffic, server hardware, Microsoft operating systems, and applications alongside VMware components, providing end-to-end visibility of your virtual infrastructure. The monitoring capability includes SNMP for network devices, API connections for cloud services, and specialized sensors for endpoints, making troubleshooting of virtual machines faster and more effective.
In PRTG, “sensors” are the basic monitoring elements. One sensor usually monitors one measured value in your network, for example the traffic of a switch port, the CPU load of a server, or the free space on a disk drive. On average, you need about 5-10 sensors per device or one sensor per switch port.
Paessler conducted trials in over 600 IT departments worldwide to tune its network monitoring software closer to the needs of sysadmins. The result of the survey: over 95% of the participants would recommend PRTG – or already have.

Paessler PRTG is used by companies of all sizes. Sysadmins love PRTG because it makes their job a whole lot easier.
Bandwidth, servers, virtual environments, websites, VoIP services – PRTG keeps an eye on your entire network.
Everyone has different monitoring needs. That’s why we let you try PRTG for free.