Custom alerts and data visualization let you quickly identify and prevent operational disruptions.
When you implement PRTG as your IT operations analyzer, you unlock the ability to see through the complexity of your infrastructure. You gain immediate insight into performance bottlenecks, potential failures, and optimization opportunities that would otherwise remain hidden beneath mountains of operational data.
Access all your critical IT metrics from a single, customizable interface that adapts to your specific needs. Set up personalized views that highlight exactly what matters most to your operation. Create multiple dashboard variants for different stakeholders to ensure everyone sees relevant information.
Identify the exact source of problems without wasting hours on manual troubleshooting and investigation. Trace issues across your infrastructure with automated correlation between related events and metrics. Reduce your mean time to resolution dramatically by pinpointing failures at their origin.
Receive instant notifications when metrics deviate from established baselines or cross predefined thresholds. Configure multi-level escalation paths to ensure the right people are notified at the right time. Customize alert delivery through various channels including email, SMS, and push notifications.
Detect potential issues before they impact your business operations or end-user experience. Leverage machine learning algorithms that learn what "normal" looks like for your environment. Prevent costly downtime by addressing problems in their earliest stages of development.
Diagnose network issues by continuously tracking device performance, service availability and application behavior. Show resource consumption, error rates and other key metrics in real time. Visualize monitoring data in clear graphs and dashboards to identify problems more easily. Gain the overview you need to troubleshoot performance degradation and prevent service disruptions.

Device tree view of the complete monitoring setup

Custom PRTG dashboard for keeping an eye on the entire IT infrastructure

Live traffic data graph in PRTG
“All-around winning
network monitor”
“The real beauty of PRTG is the endless possibilities it offers”
“PRTG Network Monitor
is very hard to beat”
Managing complex IT environments can feel like trying to solve a puzzle with missing pieces. When critical applications slow down or crash, you're left scrambling to connect the dots between different systems, while users grow increasingly frustrated and business operations grind to a halt. Without the right analysis tools, these fire drills become your daily routine.
Choose the licensing model that perfectly fits your organization's size and monitoring needs. Scale up or down as your infrastructure evolves without being locked into rigid contracts. Avoid large upfront investments with our straightforward subscription options that make budgeting predictable.
Access our knowledgeable support team whenever you encounter challenges or have questions about optimizing your monitoring setup. Benefit from extensive documentation, active community forums, and personalized assistance from PRTG specialists. Resolve issues quickly with support professionals who understand the complexities of modern IT operations.
Deploy and configure your monitoring environment without specialized expertise or lengthy training sessions. Navigate the intuitive interface that makes complex monitoring tasks accessible to IT professionals at all skill levels. Achieve rapid time-to-value with auto-discovery features that automatically identify and suggest appropriate sensors for your devices.
Connect PRTG with your existing tools and workflows through our comprehensive API and pre-built integrations. Incorporate monitoring data into your ticketing systems, collaboration platforms, and automation tools without complex coding. Extend the value of your current IT investments while adding powerful analytics capabilities.
PRTG comes with more than 250 native sensor types for monitoring your entire on-premises, cloud, and hybrid cloud environment out of the box. Check out some examples below!
The SNMP Traffic v2 sensor monitors bandwidth and traffic on a device. It can show the following:
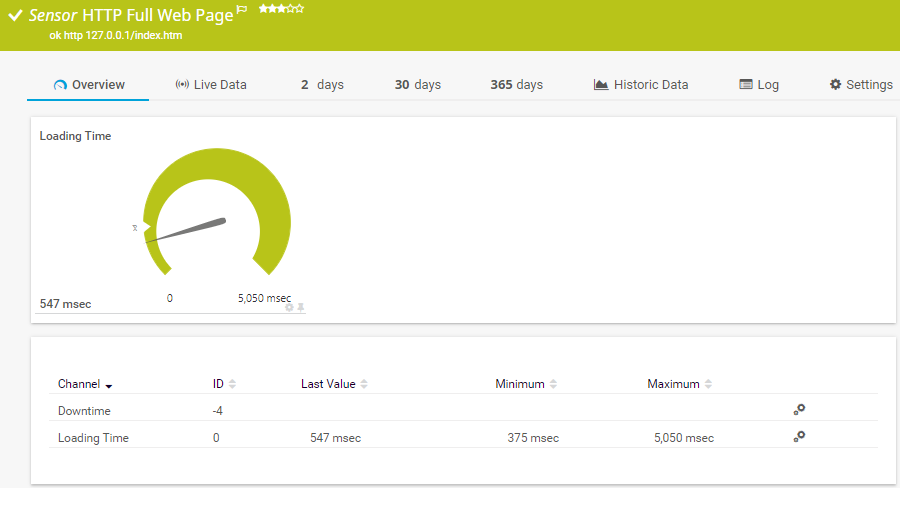
The HTTP Full Web Page sensor monitors the full download time of a web page including assets such as images. In the background, it opens the web page in a browser instance to perform the measurement. It can show the following:
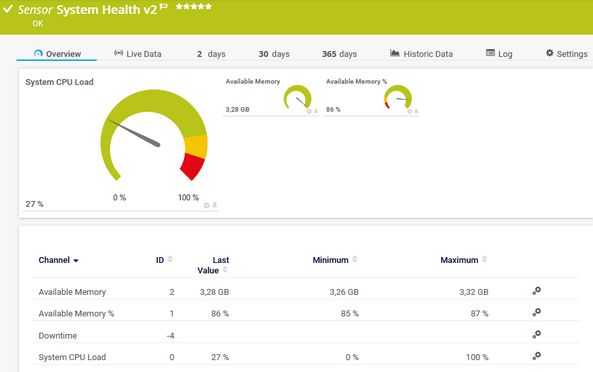
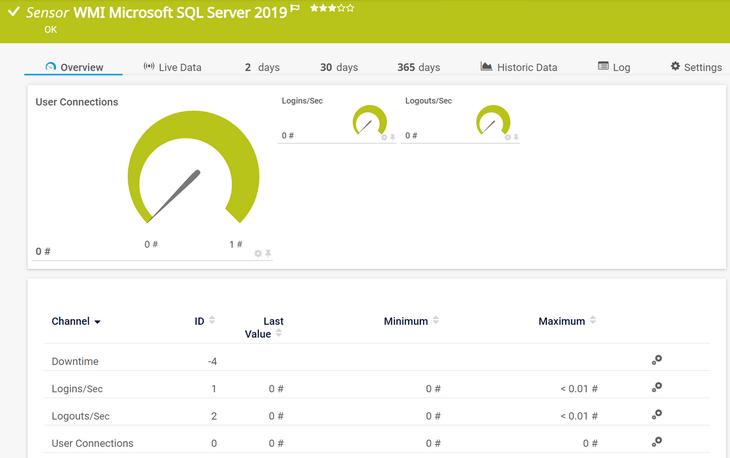
The WMI Microsoft SQL Server 2019 sensor monitors the performance of a Microsoft SQL Server. It can show the following and more:
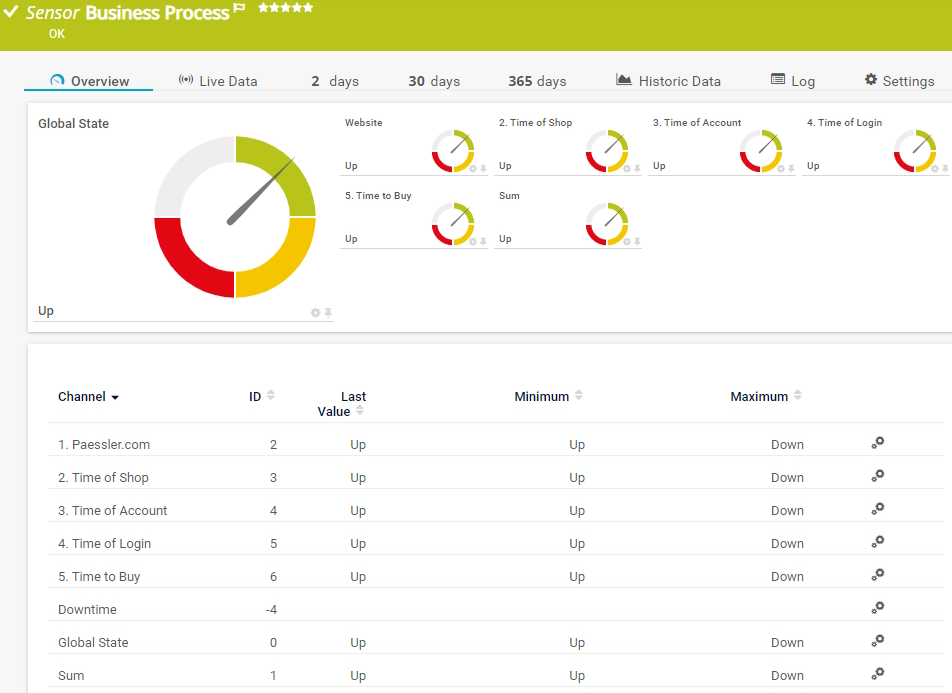
The Business Process sensor gives you a summarized status of entire business processes while monitoring several process components. This means that you can create a customized sensor with channels based on data from other source sensors. It can show the following:
See the PRTG Manual for a list of all available sensor types.

Custom alerts and data visualization let you quickly identify and prevent performance issues.
PRTG is set up in a matter of minutes and can be used on a wide variety of mobile devices.

Paessler achieved VMware's highest level of endorsement due to our technological excellence, leading market position, and superior compatibility with VMware products.
What does this mean for you?
Partnering with innovative IT vendors, Paessler unleashes synergies to create
new and additional benefits for joined customers.
baramundi and PRTG create a secure, reliable and powerful IT infrastructure where you have everything under control - from the traffic in your firewall to the configuration of your clients.
UVexplorer integrates tightly with PRTG to bring fast and accurate network discovery, detailed device inventory, and automatic network mapping to the PRTG platform.
IT that works constitutes a business-critical basis for a company's success. Availability and security must be defined for the respective purpose and closely monitored – by OT and IT alike.
Real-time notifications mean faster troubleshooting so that you can act before more serious issues occur.
Network Monitoring Software – Version 25.3.110.1313 (August 27, 2025)
Download for Windows and cloud-based version PRTG Hosted Monitor available
English, German, Spanish, French, Portuguese, Dutch, Russian, Japanese, and Simplified Chinese
Network devices, bandwidth, servers, applications, virtual environments, remote systems, IoT, and more
Choose the PRTG Network Monitor subscription that's best for you
An IT operations analyzer (ITOA) tool collects, processes, and analyzes operational data from your IT infrastructure to provide actionable insights. These tools help you to monitor system performance, identify bottlenecks, and predict potential issues before they cause outages. Modern ITOA solutions leverage artificial intelligence and machine learning to correlate events across complex IT environments, enabling faster root cause analysis and improved decision-making for IT operations management.
PRTG functions as a comprehensive IT operations analyzer by monitoring your entire IT infrastructure from a single platform. The solution tracks performance metrics across servers, networks, applications, and cloud services to provide complete observability. PRTG helps you streamline troubleshooting processes by automatically correlating events and identifying the root cause of issues. With customizable dashboards and real-time alerts, PRTG enables proactive management of IT systems, improving operational efficiency and reducing mean time to resolution for incidents.
Yes, PRTG offers robust monitoring capabilities for multi-cloud environments including AWS, Microsoft Azure, and Google Cloud. Our monitoring tool provides unified visibility across your entire cloud ecosystem, allowing you to track resource utilization, costs, and performance metrics from a single dashboard. This comprehensive approach to cloud monitoring helps you to optimize your cloud spending while ensuring optimal application performance across different cloud providers and services.
PRTG complements AIOps initiatives by providing the foundational monitoring data needed for advanced analytics. Our platform integrates with popular incident management tools through its robust API, allowing for automated ticket creation when issues are detected. PRTG can feed operational data into AIOps platforms from vendors like IBM and Hitachi, enabling pattern recognition and predictive analytics. This integration helps IT ops teams automate routine tasks, reduce alert noise, and focus on strategic initiatives that improve the overall IT service delivery.
PRTG offers comprehensive monitoring for virtually all applications and services in your IT environment. From traditional on-premises apps to cloud-native services, PRTG provides detailed APM (Application Performance Monitoring) capabilities. The platform monitors web applications, databases, mail servers, ERP systems, and custom applications. PRTG tracks key performance indicators like response times, error rates, and resource utilization, giving IT teams complete visibility into application performance from both infrastructure and end-user perspectives.
PRTG is highly scalable and can monitor environments ranging from small networks to large enterprise data centers with thousands of devices. The distributed monitoring architecture allows organizations to deploy remote probes across multiple locations while maintaining centralized management. This approach enables efficient monitoring of geographically dispersed IT infrastructure without compromising performance. PRTG handles big data volumes generated by complex IT environments, providing the scalability needed to support growing organizations while maintaining high uptime for monitoring operations.
In PRTG, “sensors” are the basic monitoring elements. One sensor usually monitors one measured value in your network, for example the traffic of a switch port, the CPU load of a server, or the free space on a disk drive. On average, you need about 5-10 sensors per device or one sensor per switch port.
Paessler conducted trials in over 600 IT departments worldwide to tune its network monitoring software closer to the needs of sysadmins. The result of the survey: over 95% of the participants would recommend PRTG – or already have.

Paessler PRTG is used by companies of all sizes. Sysadmins love PRTG because it makes their job a whole lot easier.
Bandwidth, servers, virtual environments, websites, VoIP services – PRTG keeps an eye on your entire network.
Everyone has different monitoring needs. That’s why we let you try PRTG for free.