Custom alerts and data visualization let you quickly identify and prevent energy usage spikes, overheating, excess humidity, and other issues that could raise your energy bills.
Excessive energy use is bad news all round: for your equipment’s performance, for your organization’s operational costs, and for its sustainability goals.
PRTG’s energy monitoring system collects real-time data on electricity consumption, temperature, humidity, and other metrics that could impact your bills (and your network’s stability and performance).
Set energy consumption targets, pinpoint inefficiencies and waste, and use data on long-term trends to to keep your network working smoothly and build a compelling case for energy-saving initiatives your higher-ups can’t argue with.

There’s nothing worse than energy waste (except maybe listening to accounts complain about how high your energy bills are). PRTG tracks energy consumption and other metrics in real time, so you can keep an eye on consumption patterns and optimize energy management.
Electricity consumption spiking? With PRTG, you can pinpoint the cause and fix the issue before it causes unplanned downtime. Set your preferred thresholds and you’ll be automatically alerted before your hardware gets damaged or there’s a critical malfunction.
Expand and upgrade your network, before you outgrow it. Our monitoring software tracks consumption patterns over time, so you can forecast future needs more accurately. And, with custom reports, you can prove the ROI of energy-saving initiatives in a few clicks.
Diagnose network issues by continuously tracking servers, routers, switches, PDUs, UPSs, fans, and other hardware components and environmental statistics. Show power consumption, CPU load, memory usage, temperature, humidity,and other key metrics in real time. Visualize monitoring data in clear graphs and dashboards to identify problems more easily. Gain the overview you need to troubleshoot energy usage spikes, overheating, excess humidity, and other issues that could increase your energy bills and cause network malfunctions.
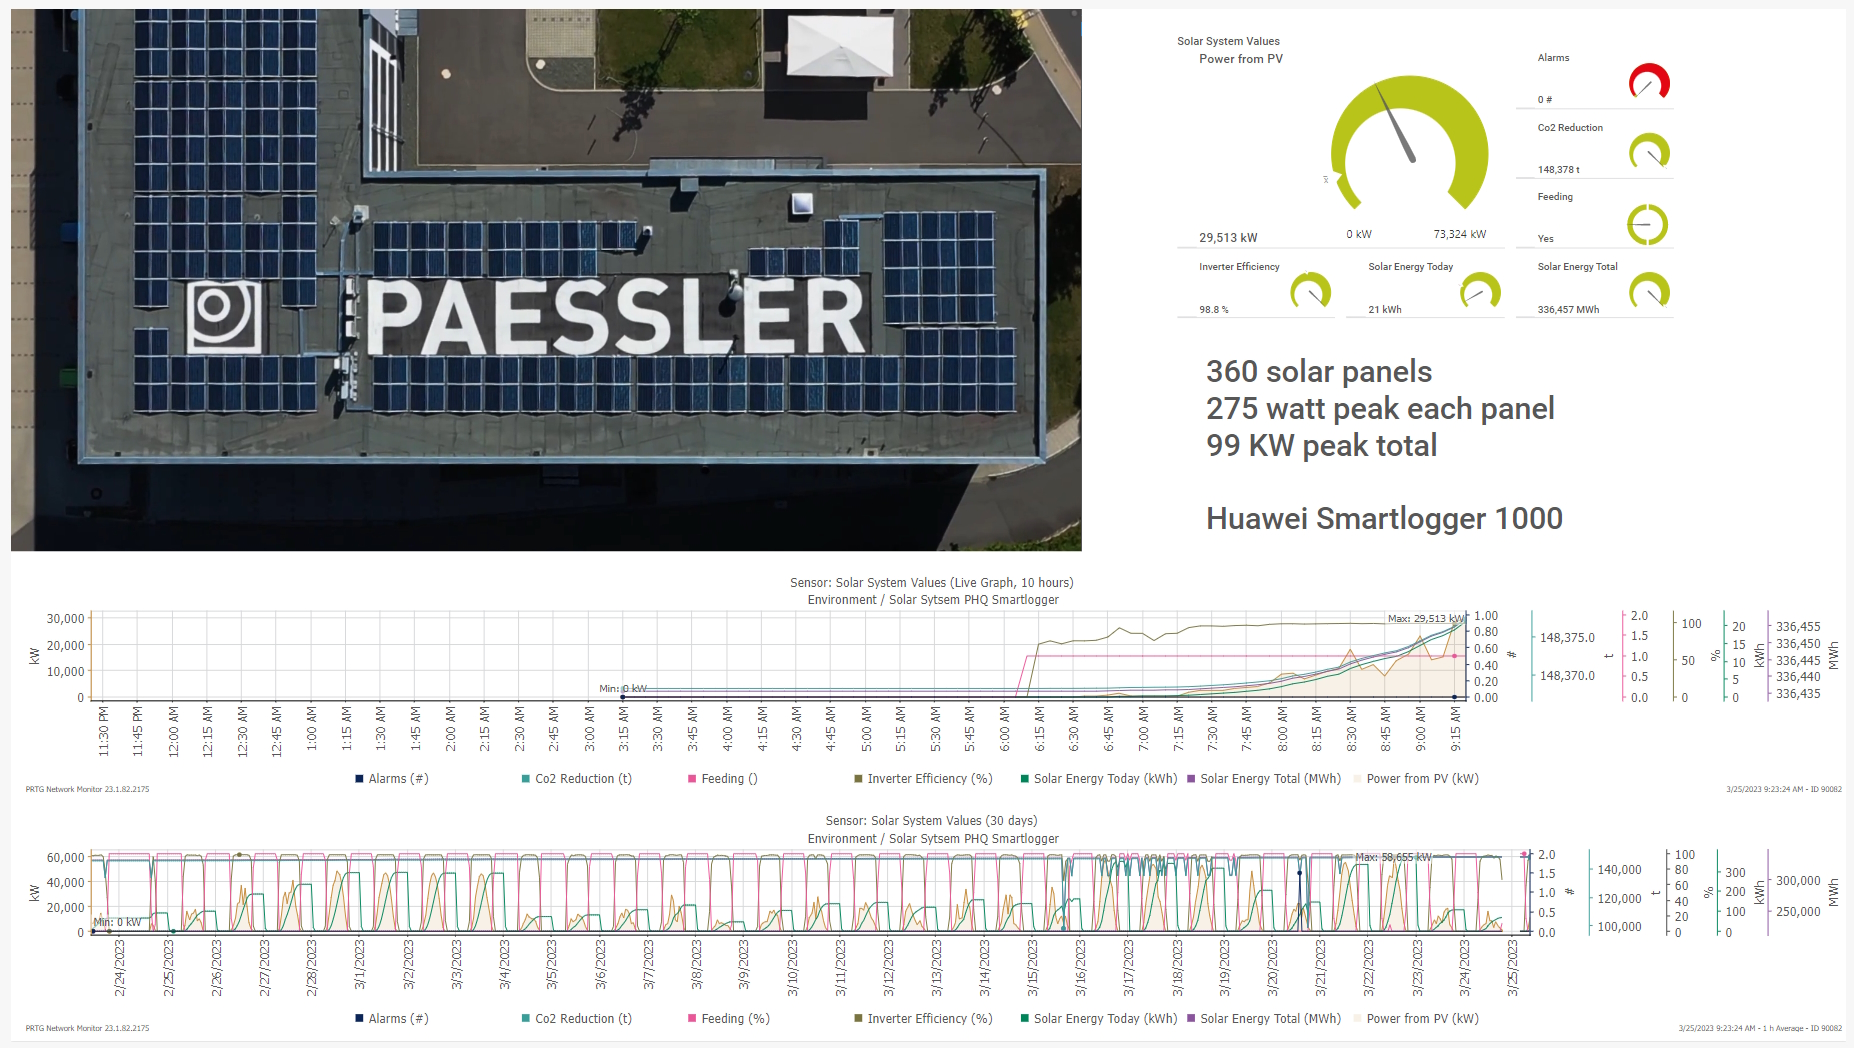
Custom PRTG dashboard for rooftop solar panels

Device tree view of the complete monitoring setup

Custom PRTG dashboard for keeping an eye on the entire IT infrastructure

Live traffic data graph in PRTG
“All-around winning
network monitor”
“The real beauty of PRTG is the endless possibilities it offers”
“PRTG Network Monitor
is very hard to beat”
One way to monitor energy consumption is the use of intelligent, metered power distribution units (PDUs) that you can easily integrate with PRTG. This way, you can determine the energy usage of your entire infrastructure as well as the consumption of each connected device.
Monitor, for example, amperage, current, voltage, phase angle, and set custom thresholds to be alerted before something critical happens to your PDUs. This not only helps reduce costly downtime, but also saves energy costs as you can avoid unnecessary energy consumption, for example by standby devices.
Monitoring your uninterruptible power supplies (UPS) cannot be underestimated. You can’t guarantee server uptime, for example, if a server is connected to an under-powered UPS that already runs at full capacity even without an impending power outage.
Set up PRTG to monitor your UPS systems with preconfigured PRTG sensors. Keep an eye on, for example, input & output voltage, battery status & remaining battery time, or overall uptime. If there is a voltage fluctuation or a power failure, PRTG immediately alerts you so that can react quickly before the issue becomes business critical.
As the operation of data centers needs huge amounts of energy, which is very cost intensive, data center operators usually want to distribute the available energy as efficiently as possible among their data center infrastructure.
Data center monitoring not only includes network devices, but also aspects such as emergency lighting and air conditioning, or environmental values like temperature and humidity. The collected information can help you to reduce energy waste and ensure suitable power distribution conditions.
PRTG comes with more than 250 native sensor types for monitoring your entire on-premises, cloud, and hybrid cloud environment out of the box. Check out some examples below!
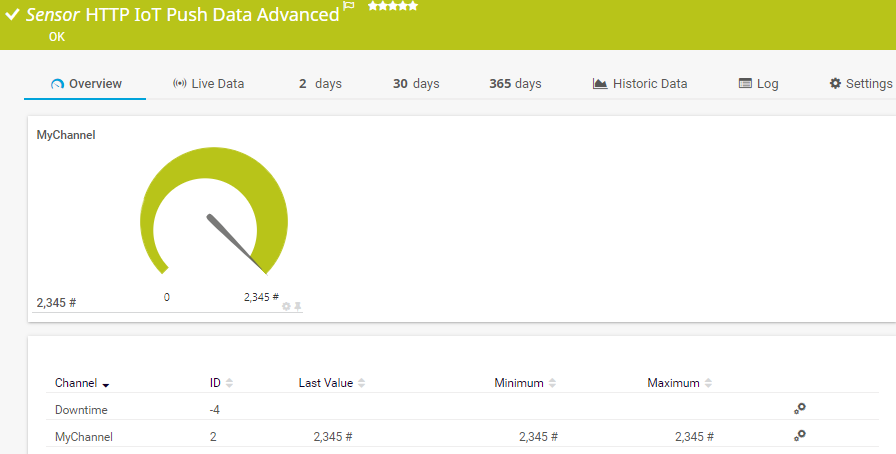
The HTTP IoT Push Data Advanced sensor displays data from messages that are received from Internet of Things (IoT) capable devices and that are pushed via an HTTPS request to PRTG. It can show the following:
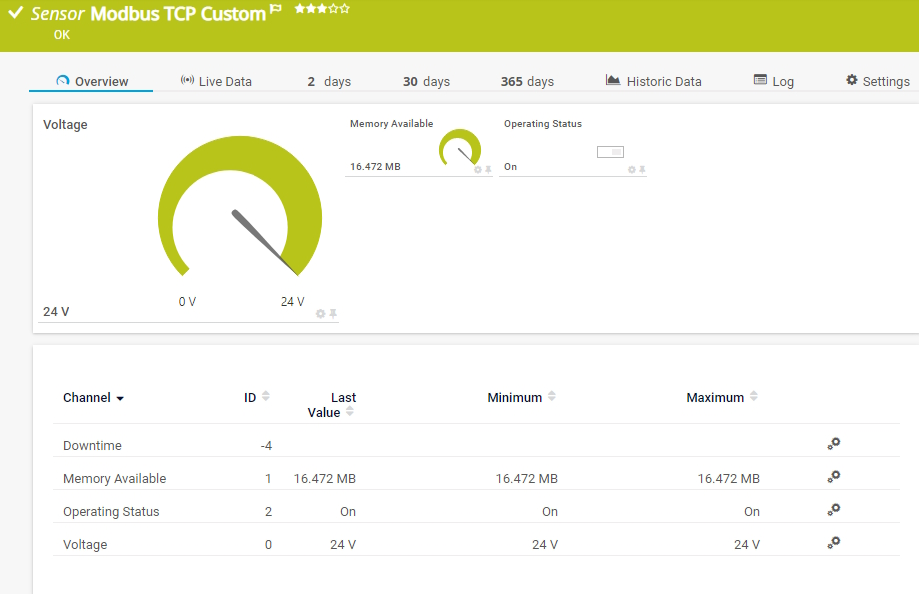
The Modbus TCP Custom sensor connects to a Modbus Transmission Control Protocol (TCP) server and monitors up to ten returned numeric values. It can show the following:
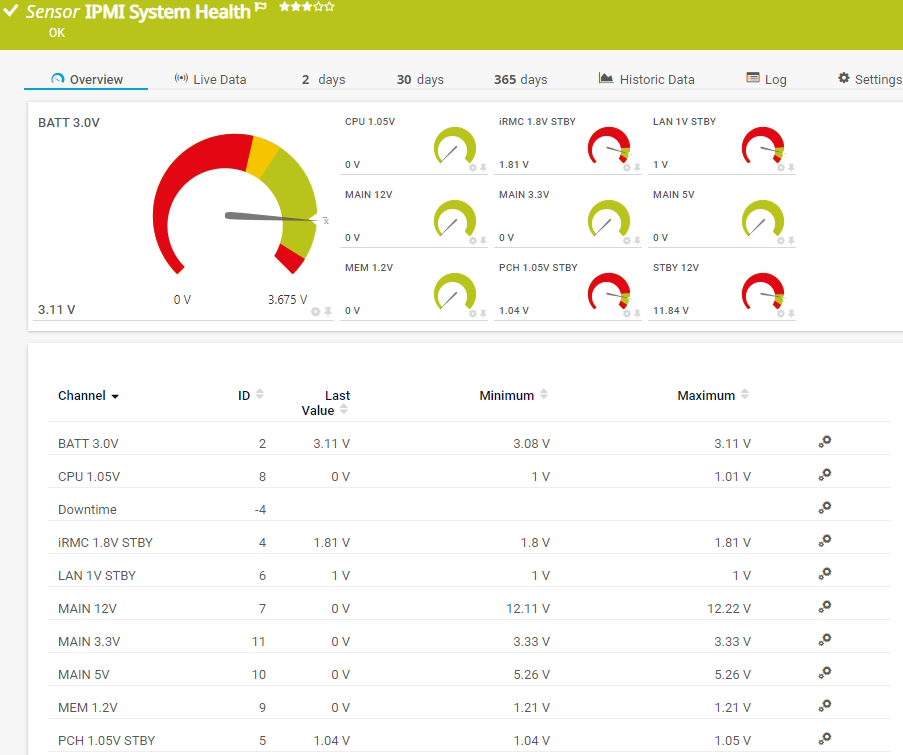
The IPMI System Health sensor monitors the status of a system via the Intelligent Platform Management Interface (IPMI). It can show the following:
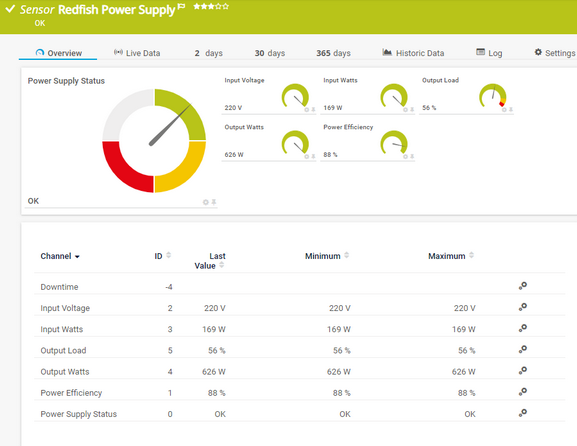
The Redfish Power Supply sensor monitors the power supply of a Redfish Scalable Platforms Management API (Redfish)-capable server. It can show the following:
See the PRTG Manual for a list of all available sensor types.

Custom alerts and data visualization let you quickly identify and prevent energy usage spikes, overheating, excess humidity, and other issues that could raise your energy bills.
PRTG is set up in a matter of minutes and can be used on a wide variety of mobile devices.


“Excellent tool for detailed monitoring. Alarms and notifications work greatly. Equipment addition is straight forward and server initial setup is very easy. ...feel safe to purchase it if you intend to monitor a large networking landscape.”
Partnering with innovative IT vendors, Paessler unleashes synergies to create
new and additional benefits for joined customers.
Combining PRTG’s broad monitoring feature set with IP Fabric’s automated network assurance creates a new level of network visibility and reliability.
Paessler and Plixer provide a complete solution adding flow and metadata analysis to a powerful network monitoring tool.
With ScriptRunner Paessler integrates a powerful event automation platform into PRTG Network Monitor.
Real-time notifications mean faster troubleshooting so that you can act before more serious issues occur.
Network Monitoring Software – Version 25.3.110.1313 (August 27, 2025)
Download for Windows and cloud-based version PRTG Hosted Monitor available
English, German, Spanish, French, Portuguese, Dutch, Russian, Japanese, and Simplified Chinese
Network devices, bandwidth, servers, applications, virtual environments, remote systems, IoT, and more
Choose the PRTG Network Monitor subscription that's best for you

Your network is energy efficient if it consumes less energy than similar networks to produce the same performance. You can measure how efficient your network is by working out the volume of data transferred relative to how much energy is consumed.
Say one of your network switches transfers 5 gigabits of data and consumes 250 watts, while another switch transfers 7 gigabits of data and consumes 250 watts. The latter switch is more energy efficient than the former.
An energy efficiency monitoring tool is a software that collects energy consumption data, analyzes it, and displays useful information to its users. This information can be viewed in different forms, for example, tables, graphs, or charts.
The main purpose of using energy efficiency monitoring tools is to control and reduce the amount of energy use, which helps to:
First, for the cost savings.
On average, a business with 50 to 250 employees consumes around 30,000 to 50,000 kilowatt hours of electricity a year, while a business with more than 250 employees consumes in excess of 50,000 kilowatt hours a year. And servers, CPUs, and other network hardware make up a significant chunk of that consumption. Collecting energy consumption data makes it easier to spot trends and optimize your network in ways that lower your bills.
Second, because your network will perform better.
Excess energy consumption can damage your hardware and cause unplanned downtime. Or, at the other end of the spectrum, it could be a sign that a piece of hardware is faulty or past its useful life. A monitoring tool will help you spot these issues before they cause critical issues.
Third, to improve your organization’s sustainability.
Lower energy consumption means fewer carbon emissions — good for the planet, and pleasing to the C-suite, who’ll be able to show investors they have healthy ESG metrics.
PRTG tracks your hardware's energy consumption, as well as other key metrics that may impact your network’s energy efficiency, such as CPU load, memory use, fans, and even environmental metrics like airflow, air pressure, temperature, and humidity using sophisticated preconfigured sensors. The sensors monitor each metric round the clock and pull the data together into easy-to-understand graphs and other visualizations, so it’s easier to spot immediate issues as well as long-term trends.
In PRTG, “sensors” are the basic monitoring elements. One sensor usually monitors one measured value in your network, for example the traffic of a switch port, the CPU load of a server, or the free space on a disk drive. On average, you need about 5-10 sensors per device or one sensor per switch port.
Paessler conducted trials in over 600 IT departments worldwide to tune its network monitoring software closer to the needs of sysadmins. The result of the survey: over 95% of the participants would recommend PRTG – or already have.

Paessler PRTG is used by companies of all sizes. Sysadmins love PRTG because it makes their job a whole lot easier.
Bandwidth, servers, virtual environments, websites, VoIP services – PRTG keeps an eye on your entire network.
Everyone has different monitoring needs. That’s why we let you try PRTG for free.