• Company
    • About Us
    • Case Studies
    • Press Center
    • Events
    • Careers
    • Blog
    • Contact us
  • Contact us
  • Login
 
  • English
    • Deutsch
    • Español
    • Français
    • Italiano
    • Português
Paessler
                    - The Monitoring Experts
  • Products
    • Paessler PRTG
      Paessler PRTGMonitor your whole IT infrastructure
      • PRTG Network Monitor
      • PRTG Enterprise Monitor
      • PRTG Hosted Monitor
      • PRTG extensionsExtensions for Paessler PRTGExtend your monitoring to a new level
    • Icon Features
      FeaturesExplore all monitoring features
      • Maps & dashboards
      • Alerts & notifications
      • Multiple user interfaces
      • Distributed monitoring
      • Customizable reporting
  • Solutions
    • Industries
      IndustriesMonitor various industry sectors
      • Industrial
      • Healthcare
      • Data Center
      • Education
      • Finance
      • Government
    • IT Topics
      IT TopicsMonitor all areas of IT
      • Network Monitoring
      • Bandwidth Monitoring
      • SNMP Monitor
      • Network Mapping
      • WiFi Monitoring
      • Server Monitoring
  • Pricing
  • Resources
    • Getting Started
      Getting StartedModules for self-paced learning
    • How-to Guides
      How-to GuidesGet the most out of PRTG
    • Videos & Webinars
      Videos & WebinarsLearn from Paessler experts
    • IT  Knowledge
      IT KnowledgeExpand your IT knowledge
    • PRTG Manual
      PRTG ManualFull documentation
    • Knowledge Base
      Knowledge BaseShare community knowledge
    • PRTG Sensor Hub
      PRTG Sensor HubGet sensors, scripts & templates
    • Trainings
      PRTG TrainingLearn how to work with PRTG
  • Partners
    • icon star
      New Partners and MSPBecome a new partner or MSP
    • icon partner
      Partner PortalLog in to your partner account
    • Deal Registration
      Deal RegistrationRegister your sales opportunities
    • icon search
      Find a PartnerFind partners selling Paessler products
    • icon technology
      Technology AlliancesSee Paessler technology partnerships
  • Company
    • About Us
    • Case Studies
    • Press Center
    • Events
    • Careers
    • Blog
    • Contact us
  • Contact us
  • Login
  • English
    • Deutsch
    • Español
    • Français
    • Italiano
    • Português
  • Get a quote
  • Free trial
  1. Home>
  2. IT Topics>
  3. Hardware>
  4. Server Uptime Monitoring
PRTG Logo

Server Uptime Monitoring with PRTG

24/7 server uptime is no myth – it’s a reality

  • Monitor physical and virtual servers on a single dashboard
  • Receive customizable alerts quicker than you can say “downtime”
  • Optimize your server infrastructure to achieve 99.999% uptime
Free download
product overview

Our users give top ratings for monitoring with Paessler PRTG

Gartner peer insights
spiceworks
G2
Capterra

PRTG server uptime monitoring: What you will find on this page

Table of content
  • Avoid costly service interruption with tracking server uptime
  • What server uptime monitoring looks like in PRTG
  • 5 reasons why to choose PRTG as your server uptime monitoring tool
  • Preconfigured PRTG sensors for Server Uptime Monitoring
  • Monitor server uptime: FAQ

PRTG makes server uptime monitoring as easy as it gets

Custom alerts and data visualization let you quickly identify and prevent issues with server downtime and outages.

Free download
PRODUCT OVERVIEW

Avoid costly service interruption with tracking server uptime

We totally get it. Servers and services that are regularly unavailable are a major business risk. And when user satisfaction drops, revenue is lost, and maintenance costs skyrocket, it’s a tough spot to be in. But don’t panic, as Paessler PRTG is here to help you – designed to keep your servers running all day, every day.

Icon Click

Nail uptime issues with accuracy

Accurate and fast response times make all the difference when an issue arises. PRTG server uptime monitoring tools use monitoring protocols like ICMP, SNMP, SMTP, and WMI, alongside packet sniffing and NetFlow, to detect and diagnose issues quickly.

This helps you to troubleshoot server overloads, hardware failures, and system bottlenecks promptly – for high availability and continuous service.

Icon Alarm

Get customizable, instant alerts

You need to know as soon as possible when there’s an uptime issue. PRTG will send you immediate alerts via email, SMS, push notification, Slack message, and others when a threshold is breached.

Configure these alerts to your needs to focus on key uptime metrics that matter most to you. Your ability to proactively monitor your server uptime will make you look psychic. Employ your newfound powers to impress the CTO.

Icon Eye

Streamline your server monitoring

Keep an eagle eye on your entire IT infrastructure with a single comprehensive network monitoring tool that reduces complexity and does away with compatibility issues.

Our server uptime monitoring solution gives you a top-down view of your entire network’s health. This makes it much easier to maintain high uptime by spotting and addressing issues proactively.

Icon Lock

Ensure data security and integrity

Nobody wants strangers digging through their data. With PRTG, your monitoring data is secured through SSL/TLS encryption, using the strongest ciphers available to prevent unauthorized access.

This security is critical not only for protecting sensitive information but also for ensuring that uptime monitoring is not compromised by external threats.

What server uptime monitoring looks like in PRTG

Diagnose network issues by continuously tracking your server environment. Show server uptime, availability, and health metrics in real time. Visualize monitoring data in clear graphs and dashboards to identify problems more easily. Gain the overview you need to troubleshoot the root causes of issues with your entire server network infrastructure.

PRTG Screenshot device tree view

Device tree view of the complete monitoring setup

PRTG screenshot map entire it infrastructure

Custom PRTG dashboard for keeping an eye on the entire IT infrastructure

PRTG screenshot graph live data traffic

Live traffic data graph in PRTG

Map hardware monitoring

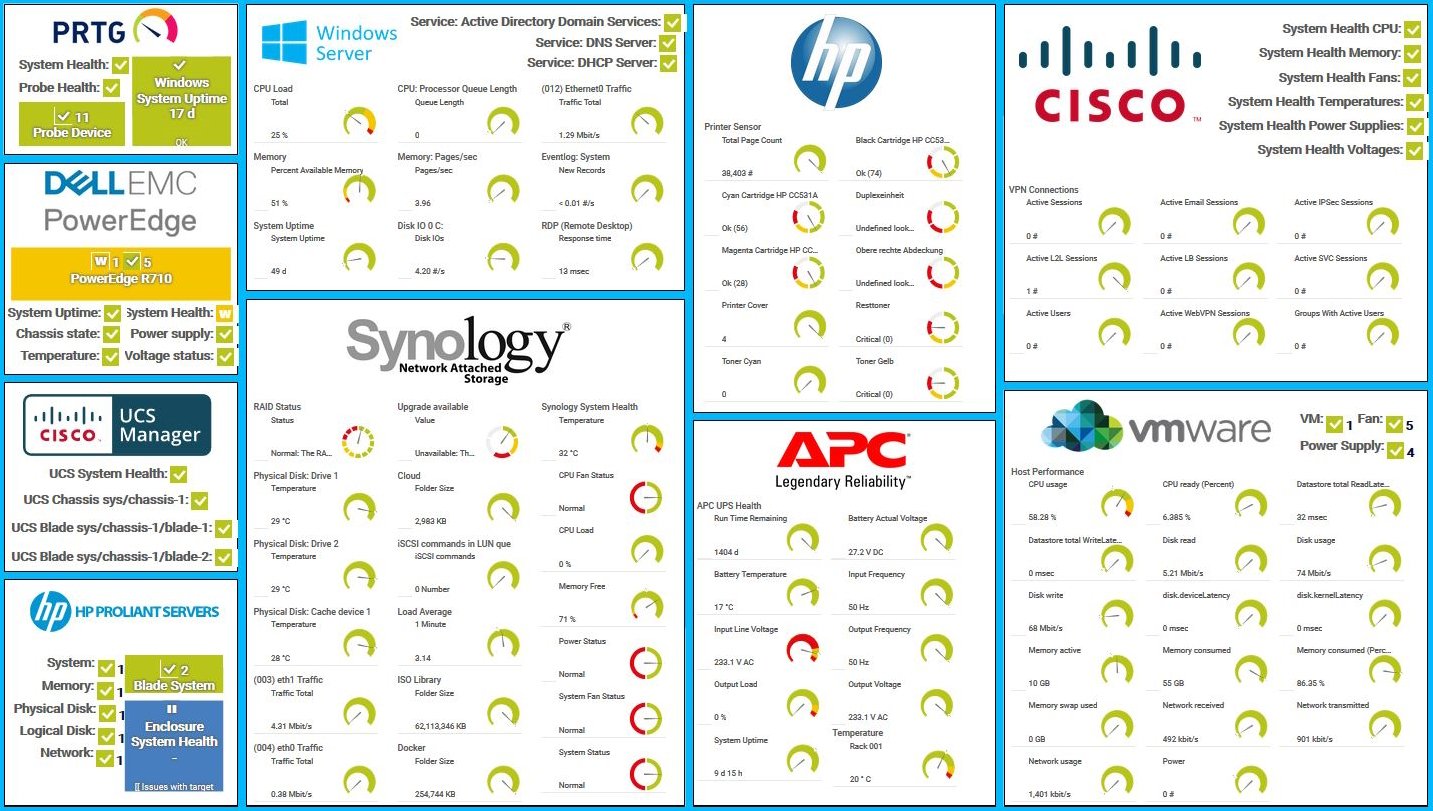
Custom PRTG dashboard for hardware monitoring

Start monitoring server uptime with PRTG and see how it can make your network more reliable and your job easier

Free download
PRODUCT OVERVIEW

IT experts agree: Paessler PRTG is a great solution for IT infrastructure monitoring

PCMag

“All-around winning
 network monitor”

IT Brief

“The real beauty of PRTG is the endless possibilities it offers”

ITPro

“PRTG Network Monitor 
is very hard to beat”


5 reasons why to choose PRTG as your server uptime monitoring tool

We have your servers covered

PRTG monitors the availability and health of your physical and virtual servers, DNS servers, mail servers, SQL servers, web servers, file servers,, SQL servers, web servers, file servers, Windows server, and more, using technologies such as SNMP, WMI, SSH, or Ping. Points of failure dwindle, and your peace of mind increases.

Get the data from now, right now

Dynamic dashboards and graphs, included with our uptime monitoring service, provide live feedback on the status of your servers, whether you're at your desk or halfway around the world. This real-time data is crucial for everyone involved to quickly make informed decisions and address issues.

Simply scalable server solution

PRTG grows with your business – easily integrate additional server endpoints and analyze increased network traffic without performance loss. Its flexible licensing, pricing, and architecture supports you all the way if you want to expand within data centers or across multiple monitoring locations.

Wide vendor compatibility

We designed PRTG to be compatible with most major hardware manufacturers out of the box. Easily integrate servers and other network devices from Dell, Cisco, HPE, IBM, Fujitsu, or Microsoft into your monitoring infrastructure via prebuilt sensor templates for a greater user experience.

Agentless monitoring software

PRTG makes server uptime monitoring as simple as possible. With it’s agentless monitoring architecture, you can monitor all server types without the need to install additional software on your network devices. The use of standard protocols and an easy-to-understand API reduces overhead.

Explore our preconfigured PRTG sensors for Server Uptime Monitoring

PRTG comes with more than 250 native sensor types for monitoring your entire on-premises, cloud, and hybrid cloud environment out of the box. Check out some examples below!

Ping v2

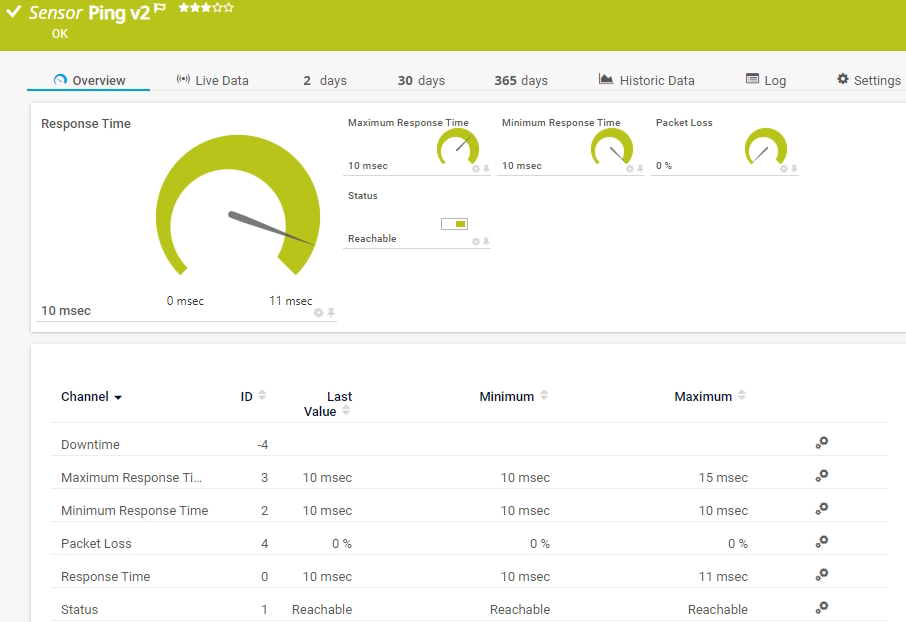
The Ping v2 sensor sends an Internet Control Message Protocol (ICMP) echo request ("ping") from the probe system to the parent device to monitor its availability. It can show the following:

• Response time

• Packet loss

• Target status

• Minimum and maximum ping time

Ping v2
Ping v2

SNMP Uptime v2

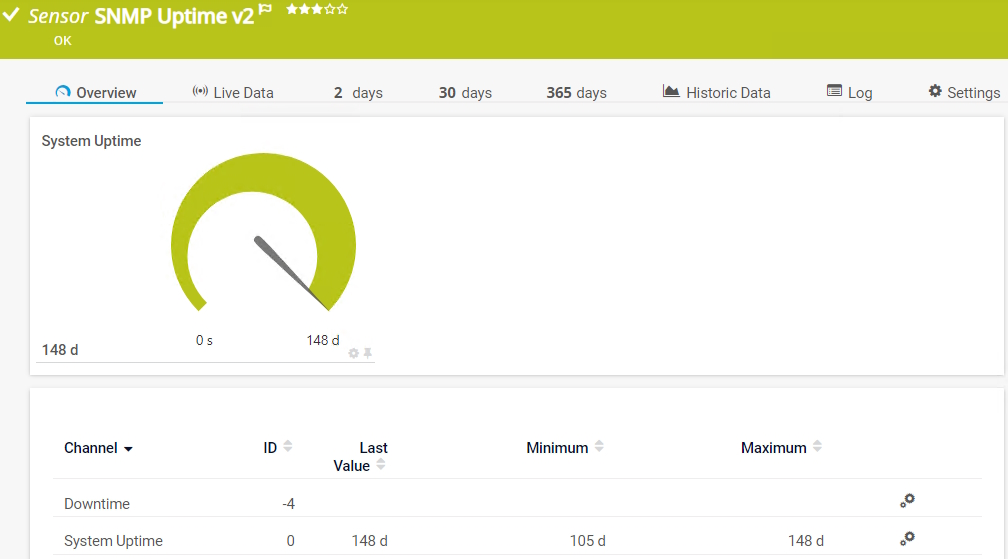
The SNMP Uptime v2 sensor monitors the uptime of a device. It can show the following:

  • Downtime
  • System uptime
SNMP Uptime v2
SNMP Uptime v2

Windows System Uptime

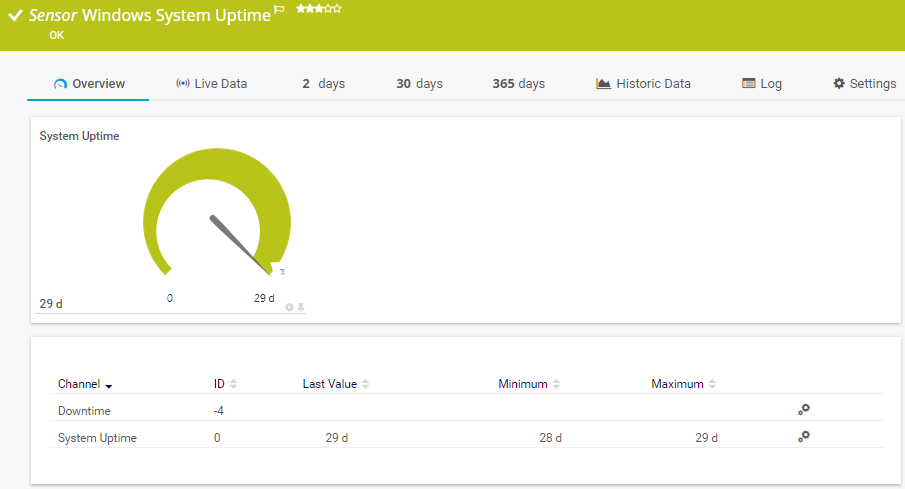
The Windows System Uptime sensor monitors the uptime of a Windows system via Windows Management Instrumentation (WMI) or Windows performance counters. It can show the following:

  • Downtime
  • System uptime
Windows System Uptime

See the PRTG Manual for a list of all available sensor types.

PRTG is compatible with all major vendors, products, and systems

compatible with all major vendors, products, and systems

Find the root cause of the problem with our PRTG server uptime monitoring solution

Real-time notifications mean faster troubleshooting so that you can act before more serious issues occur.

Free download
PRODUCT OVERVIEW

“From a server perspective, we're monitoring all of the key components of our service such as CPU usage, RAM disk space, the Windows services that it's running, and network connectivity of that server. In terms of networks, we’re monitoring all of our switches, firewalls, and access points. It’s really useful to be able to easily pull performance metrics from the PRTG dashboard.”

Ollie Kerslake, Infrastructure Lead
Riverford Organic Farmers

“The tool has given us greater control over all types of devices connected to the network (switches, IP telephony, security cameras, IoT, WiFi) that previously remained opaque when dealing with service incidents. This has improved our ability to diagnose and resolve problems, which has translated into greater efficiency and a better user experience in both internal and public services.”

Jordi Tolosà Bel, New Technologies Technician
Vinaroz City Council

“Our objective was to be able to monitor the health of our most critical servers containing data and applications, but also the flows and bandwidth between headquarters, our 50 servers in the cloud and the 15 servers at our production sites. For us, it is essential to have a proactive approach to understand where the weaknesses of the IT system are to be able to improve them.”

Marc Boullier, CIO
Carambar & Co

Your server uptime monitor at a glance – even on the go

PRTG is set up in a matter of minutes and can be used on a wide variety of mobile devices.

device overview
Dell

We are a Dell Technologies Partner  

As one of the leading players in the IT monitoring industry, Paessler has also become an authorized Dell partner for building integrated solutions around the Dell technology ecosystem.

What does this mean for you?

  • Easy integration of Dell hardware and software with PRTG
  • State-of-the-art features for monitoring your Dell environment
  • Expert technical support around your Dell monitoring setup

Create innovative solutions with Paessler’s IT partners

Partnering with innovative IT vendors, Paessler unleashes synergies to create
new and additional benefits for joined customers.

Rittal

Rittal

IT that works constitutes a business-critical basis for a company's success. Availability and security must be defined for the respective purpose and closely monitored – by OT and IT alike.

Read more
NetBrain

NetBrain

Integrating monitoring results from PRTG into NetBrain maps makes the foundation for network automation.

Read more
ScriptRunner

ScriptRunner

With ScriptRunner Paessler integrates a powerful event automation platform into PRTG Network Monitor.

Read more

PRTG makes server uptime monitoring as easy as it gets

Custom alerts and data visualization let you quickly identify and prevent issues with server downtime and outages.

Free download
PRODUCT OVERVIEW
Paessler PRTG

Paessler PRTG

Network Monitoring Software – Version 25.2.108.1358 (July 2, 2025)

Hosting icon

Hosting

Download for Windows and cloud-based version PRTG Hosted Monitor available

Languages icon

Languages

English, German, Spanish, French, Portuguese, Dutch, Russian, Japanese, and Simplified Chinese

test

Monitor everything

Network devices, bandwidth, servers, applications, virtual environments, remote systems, IoT, and more

test

Pricing

Choose the PRTG Network Monitor subscription that's best for you

Discover more monitoring insights and stories

Resources Solution

Solutions for all your monitoring needs

  • Availability monitoring
  • Uptime monitoring
  • Server Availability Monitoring
Resources Content

Powerful stories from the monitoring world

  • The Uptime Myth: Why Uptime Does Not Mean Availability
  • Top sensors in PRTG to monitor your Dell, HPE and IBM server hardware
  • Customer success story Total Uptime & PRTG
Resources Solutions

Resources to master your monitoring challenges

  • Windows Server Uptime sensor is wrong
  • How to generate automated report of server uptime?
  • Server group uptime displayed in a map

Server Uptime Monitoring: FAQ


What is server uptime?

Server uptime refers to the total time a server has been continuously operational and available without any interruptions or downtime. It is typically expressed as a percentage and is a critical measure of a server's reliability and stability. High uptime percentages indicate that the server is consistently available and functioning properly, which is crucial for maintaining the performance and accessibility of services hosted on the server, such as websites, applications, and databases.

For instance, an uptime of 99.9% means the server has been down for only about 8.76 hours over the course of a year. Achieving high uptime is essential for businesses and organizations that rely on their online presence and digital services, as downtime can lead to lost revenue, reduced end user satisfaction, and potential damage to the company's reputation.

What is server uptime monitoring?

Server uptime monitoring is the process of continuously tracking and analyzing the operational status and performance of servers to ensure they are running efficiently and are accessible. This practice involves using specialized tools and software to monitor various aspects of server performance, detect issues, and alert administrators to potential problems.

Key components of server uptime monitoring include:

  • Availability checks: Regularly pinging or sending requests to the server to check if it is online and responding as expected.
  • Performance monitoring: Checking CPU usage, memory usage, disk space, network traffic, and other performance indicators to ensure the server is operating within acceptable parameters.
  • Service monitoring: Tracking the status of specific services and applications running on the server to ensure they are functioning correctly. This also involves, for example, website uptime monitoring including checking SSL certificate expiry.
  • Alerting and notifications: Sending alerts and notifications to administrators or IT staff when a server goes down, or when performance metrics exceed predefined thresholds. These alerts can be sent via email, SMS, or other communication channels.
  • Reporting: Generating reports and analytics to provide insights into server performance over time, identify trends, and support capacity planning.
  • Health checks: Performing deeper checks on server health, such as verifying database connections, checking log files for errors, and ensuring security patches are applied.
Why should I monitor server uptime?

Monitoring server uptime is essential for several reasons, particularly for businesses and organizations that rely on their servers for critical operations. Here are some key reasons to monitor server uptime:

  • Ensure service availability: Consistent server uptime means that your services, whether they are websites, applications, or databases, are available to users. Downtime can lead to inaccessible services, which can frustrate users and drive them to competitors.
  • Minimize downtime: Monitoring allows for the early detection of potential issues, enabling quick responses to prevent or minimize downtime. Proactive problem resolution can significantly reduce the duration and frequency of service interruptions.
  • Maintain user satisfaction: High uptime is crucial for maintaining a positive user experience. Frequent downtimes or slow performance can lead to user dissatisfaction, negatively impacting your reputation and customer loyalty.
  • Protect revenue: For e-commerce sites, SaaS businesses, and other online services, downtime can result in lost sales and revenue. Ensuring high availability directly impacts the bottom line.
  • Meet SLAs (Service Level Agreements): Many businesses have SLAs that guarantee a certain level of service uptime to their clients. Monitoring helps ensure compliance with these agreements, avoiding potential penalties and maintaining client trust.
  • Optimize performance: Monitoring server uptime and performance metrics helps in identifying performance bottlenecks and optimizing resource usage. This can lead to improved server efficiency and user experience.
How does PRTG detect early signs of server downtime?

PRTG uses a variety of monitoring checks, such as ping tests, SNMP scans for hardware status, and bandwidth usage analysis to alert you at the first sign of operational trouble.

Can PRTG differentiate planned maintenance from unexpected downtime?

Yes, PRTG allows for the definition of maintenance windows, during which alerts for planned downtimes are suppressed, ensuring that only unexpected disruptions are flagged and addressed.

How can I measure the reliability of my servers over time?

PRTG provides extensive reporting capabilities that track uptime and downtime incidents, giving you a clear picture of your servers' reliability and helping you to optimize uptime strategies.

Is there a limit to the number of servers and devices PRTG can monitor for uptime?

No, PRTG is designed to scale with your infrastructure, capable of monitoring an extensive array of servers and devices across multiple locations and platforms.

What is a sensor in PRTG?

In PRTG, “sensors” are the basic monitoring elements. One sensor usually monitors one measured value in your network, for example the traffic of a switch port, the CPU load of a server, or the free space on a disk drive. On average, you need about 5-10 sensors per device or one sensor per switch port.

We asked: would you recommend PRTG? Over 95% of our customers say yes!

Paessler conducted trials in over 600 IT departments worldwide to tune its network monitoring software closer to the needs of sysadmins. The result of the survey: over 95% of the participants would recommend PRTG – or already have.

recommendation

Still not convinced?

Love

More than 500,000 sysadmins love PRTG

Paessler PRTG is used by companies of all sizes. Sysadmins love PRTG because it makes their job a whole lot easier.

PRTG

Monitor your entire IT infrastructure

Bandwidth, servers, virtual environments, websites, VoIP services – PRTG keeps an eye on your entire network.

test

Try Paessler PRTG for free

Everyone has different monitoring needs. That’s why we let you try PRTG for free.

PRTG Logo

Start monitoring server uptime with PRTG and see how it can make your network more reliable and your job easier

Free download
PRODUCT OVERVIEW

Products

  • Paessler PRTG
    Paessler PRTGMonitor your whole IT infrastructure
    • PRTG Network Monitor
    • PRTG Enterprise Monitor
    • PRTG Hosted Monitor
    • PRTG extensions
      Extensions for Paessler PRTGExtend your monitoring to a new level
  • Icon Features
    FeaturesExplore all monitoring features

Monitoring with PRTG

  • Network monitoring
  • Bandwidth monitoring
  • SNMP monitoring
  • Network mapping
  • Wi-Fi monitoring
  • Server monitoring
  • Network traffic analyzer
  • NetFlow monitoring
  • Syslog server

Useful Links

  • PRTG Manual
  • Knowledge Base
  • Customer Success Stories
  • About Paessler
  • Subscribe to newsletter
  • PRTG Support
  • PRTG Consulting
  • PRTG Feedback & Roadmap

Contact

Paessler GmbH
Thurn-und-Taxis-Str. 14, 
90411 Nuremberg 
Germany

[email protected]

+49 911 93775-0

  • Contact us
©2025 Paessler GmbHTerms & ConditionsPrivacy PolicyImprintReport VulnerabilityDownload & InstallSitemap
Application Performance Monitoring Tool Application Performance Monitoring Tool Application Performance Monitoring Tool