Custom alerts and data visualization let you quickly identify and prevent network outages and performance issues.
Are you struggling to maintain visibility across your complex IT infrastructure while ensuring minimal downtime? A Network Operations Center requires comprehensive monitoring tools that provide real-time insights and alert you to potential issues before they impact your business. With Paessler PRTG, you can transform your NOC into a proactive command center that anticipates problems and resolves them quickly.
Create customizable network performance monitoring dashboards that display critical metrics at a glance. Your NOC team can monitor everything from a single interface, eliminating the need to switch between multiple tools. The intuitive map designer lets you build visual representations of your infrastructure with real-time status updates.
Receive instant notifications when performance thresholds are exceeded or when systems begin to show signs of trouble. Your team can respond to potential issues before they escalate into major problems that affect end users. Set up availability monitoring with custom thresholds tailored to your specific business requirements.
Generate detailed reports on performance, availability, and bandwidth monitoring with just a few clicks. Your management team can access the information they need without requiring technical expertise. Schedule regular reports to be delivered automatically to stakeholders to demonstrate service level compliance.
Scalable architecture
Deploy monitoring capabilities that grow with your business without performance degradation. Your IT infrastructure monitoring remains effective whether you're monitoring hundreds or thousands of devices. Implement distributed monitoring with remote probes to monitor geographically dispersed locations from a central NOC.
Diagnose network issues by continuously tracking device status, bandwidth utilization and response times. Show network traffic patterns and other key metrics in real time. Visualize monitoring data in clear graphs and dashboards to identify problems more easily. Gain the overview you need to troubleshoot infrastructure bottlenecks and performance degradation.

Device tree view of the complete monitoring setup

Custom PRTG dashboard for keeping an eye on the entire IT infrastructure

Live traffic data graph in PRTG
“All-around winning
network monitor”
“The real beauty of PRTG is the endless possibilities it offers”
“PRTG Network Monitor
is very hard to beat”
Running a Network Operations Center comes with constant pressure - unexpected outages, mysterious performance issues, and the challenge of managing multiple monitoring tools that don't talk to each other. When critical systems go down at 3 AM, you need a solution that not only alerts you immediately, but also helps pinpoint exactly where the problem lies. Without proper monitoring, you're essentially flying blind.
Adapt your monitoring capabilities to match your exact requirements without overpaying for unused capacity. Select the subscription plan that best fits your organization's size and monitoring needs. Implement distributed monitoring across multiple locations while maintaining centralized management of your entire infrastructure.
Access knowledgeable assistance whenever you encounter challenges with your monitoring setup. Benefit from comprehensive documentation, active user forums, and direct support from monitoring specialists who understand your NOC environment. Use agentless monitoring capabilities that simplify deployment and reduce maintenance overhead across your network infrastructure monitoring.
Get your NOC monitoring solution up and running in minutes instead of hours or days. Use auto-discovery features that identify network devices and suggest appropriate sensors automatically. Implement server security monitoring and network security monitoring quickly to protect your infrastructure while maintaining visibility into performance metrics.
Navigate through complex monitoring data with ease thanks to a user-friendly design that requires minimal training. Customize your views to focus on the metrics that matter most to your specific NOC requirements. Create custom network diagrams that provide visual representations of your infrastructure, and implement continuous monitoring workflows that keep you informed of status changes.
PRTG comes with more than 250 native sensor types for monitoring your entire on-premises, cloud, and hybrid cloud environment out of the box. Check out some examples below!
The SNMP Traffic v2 sensor monitors bandwidth and traffic on a device. It can show the following:
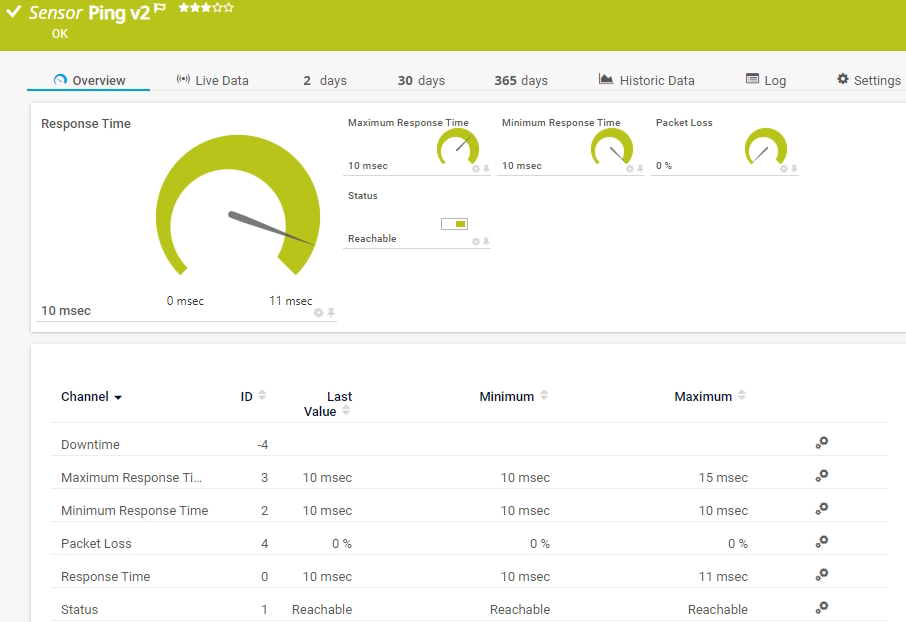
The Ping v2 sensor sends an Internet Control Message Protocol (ICMP) echo request ("ping") from the probe system to the parent device to monitor its availability. It can show the following:
• Response time
• Packet loss
• Target status
• Minimum and maximum ping time
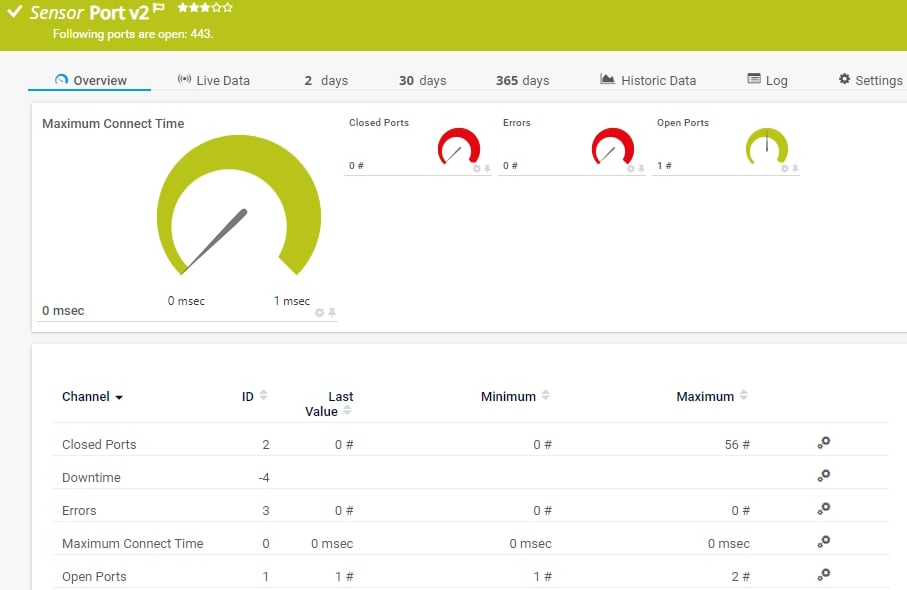
The Port v2 sensor monitors a network service by connecting to one or more of its TCP/IP ports. It can show the following:
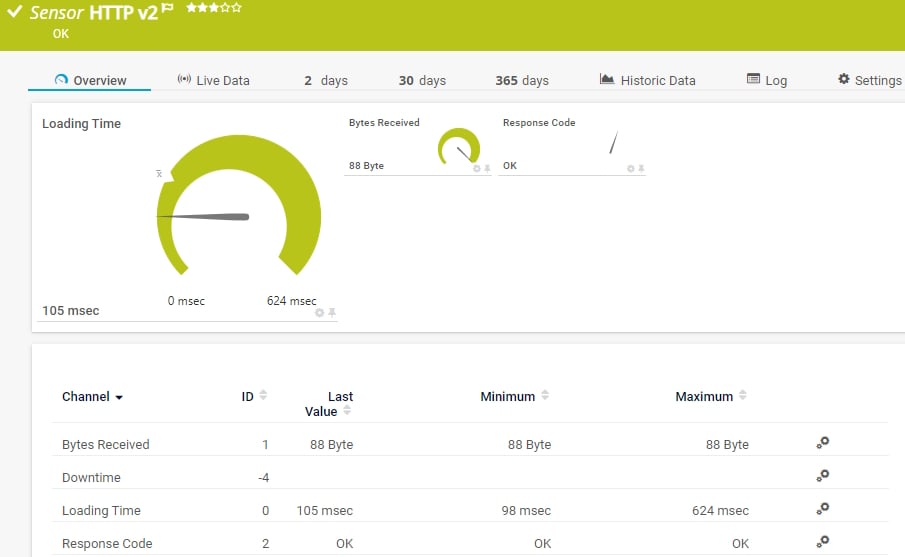
The HTTP v2 sensor monitors a web server. It can show the following:
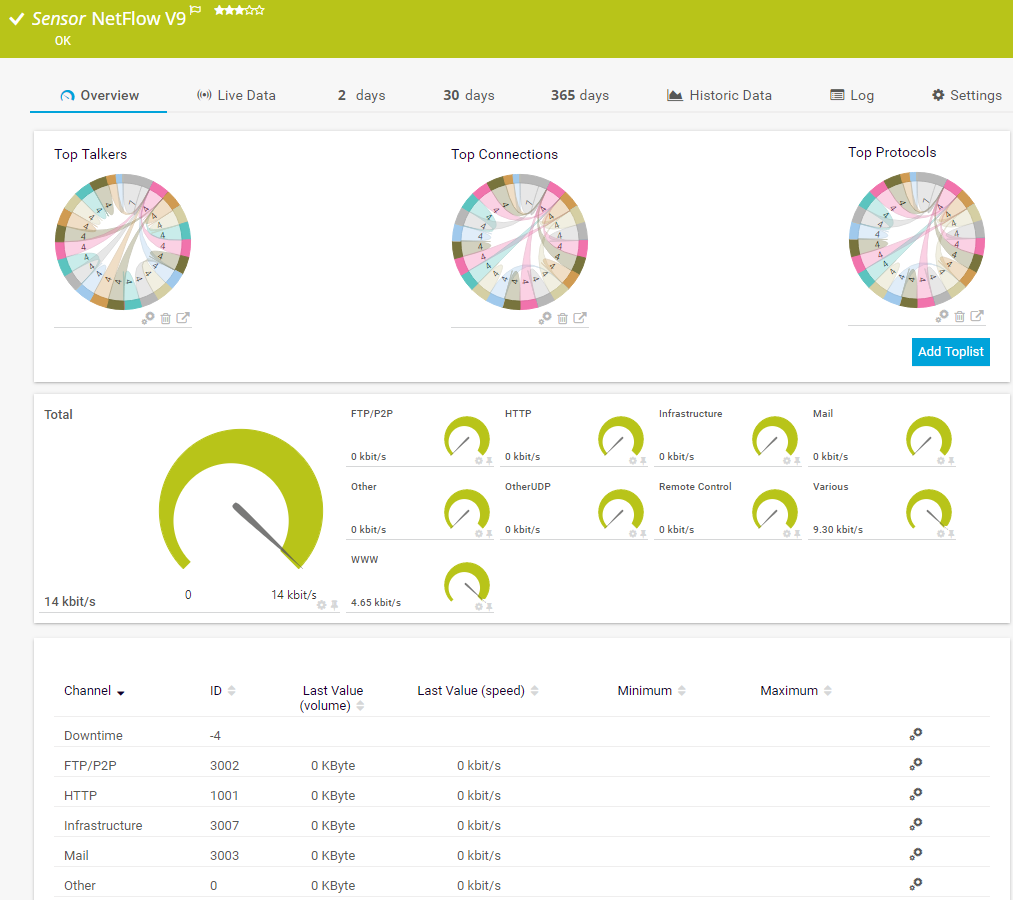
The NetFlow v9 sensor receives traffic data from a NetFlow v9-compatible device and shows the traffic by type. This sensor has several filter options to divide traffic into different channels. It can show the following and more:
See the PRTG Manual for a list of all available sensor types.

Custom alerts and data visualization let you quickly identify and prevent service disruptions and bandwidth bottlenecks.
PRTG is set up in a matter of minutes and can be used on a wide variety of mobile devices.

Paessler achieved VMware's highest level of endorsement due to our technological excellence, leading market position, and superior compatibility with VMware products.
What does this mean for you?
Partnering with innovative IT vendors, Paessler unleashes synergies to create
new and additional benefits for joined customers.
IT that works constitutes a business-critical basis for a company's success. Availability and security must be defined for the respective purpose and closely monitored – by OT and IT alike.
baramundi and PRTG create a secure, reliable and powerful IT infrastructure where you have everything under control - from the traffic in your firewall to the configuration of your clients.
Integrating monitoring results from PRTG into NetBrain maps makes the foundation for network automation.
Real-time notifications mean faster troubleshooting so that you can act before more serious issues occur.
Network Monitoring Software – Version 25.3.110.1313 (August 27, 2025)
Download for Windows and cloud-based version PRTG Hosted Monitor available
English, German, Spanish, French, Portuguese, Dutch, Russian, Japanese, and Simplified Chinese
Network devices, bandwidth, servers, applications, virtual environments, remote systems, IoT, and more
Choose the PRTG Network Monitor subscription that's best for you
A NOC monitoring tool is software that enables network management and oversight of an organization's IT infrastructure from a centralized location. Network operations center (NOC) monitoring tools help IT teams track network performance, detect issues, and respond to incidents before they impact business operations. These tools provide real-time visibility into network devices, servers, applications, and other critical infrastructure components, allowing NOC engineers and NOC technicians to maintain optimal system performance and quickly address potential security threats.
PRTG streamlines incident management through comprehensive monitoring capabilities that detect issues before they escalate. When problems occur, PRTG automatically triggers alerts based on predefined thresholds, enabling rapid incident response. Our platform integrates with popular ticketing systems to create and track issues throughout their lifecycle. NOC teams can establish clear escalation paths to ensure the right personnel address critical problems promptly. With PRTG, your IT operations team can implement standardized workflows for common issues, reducing resolution time and improving service delivery for managed services clients.
Yes, PRTG offers flexible deployment options for monitoring both traditional on-premises infrastructure and cloud-based environments. The platform provides comprehensive visibility across hybrid networks, allowing you to monitor physical servers, virtual machines, network devices, and cloud services from a single interface. This unified approach eliminates blind spots between your in-house systems and cloud resources. PRTG includes specialized sensors for monitoring major cloud providers and SaaS applications, making it an ideal solution for organizations with diverse IT environments.
PRTG enables MSPs and service providers to deliver comprehensive NOC services through multi-tenant capabilities and remote monitoring features. Service providers can monitor client networks from a central location, reducing the need for on-site visits. Our solution’s automation capabilities streamline routine tasks like patch management and antivirus updates. PRTG helps you maintain client SLAs by providing detailed performance metrics and uptime reporting. MSPs can create custom dashboards for each client, displaying relevant metrics and demonstrating the value of their services. This makes PRTG a cost-effective solution for delivering professional IT services to multiple clients.
PRTG complements SOC operations by providing essential monitoring data that helps identify potential security incidents. The platform monitors firewalls, intrusion detection systems, and other security infrastructure to ensure proper functioning. PRTG can detect unusual network behavior that might indicate a security breach, such as unexpected traffic patterns or unauthorized access attempts. Integration with cybersecurity tools allows for coordinated remediation efforts between NOC and SOC teams. Vulnerability monitoring capabilities help identify potential weak points before they can be exploited.
PRTG provides several specialized sensors for monitoring user experience metrics across your network. The platform can track application response times, website performance, and service availability from the end user perspective. Synthetic monitoring capabilities simulate user interactions to identify potential issues before they affect real users. Detailed performance metrics help identify bottlenecks in the network, applications, or telecommunications systems that might impact user satisfaction. By monitoring the entire service delivery chain, PRTG helps ensure consistent performance for both internal users and customers accessing your business process applications.
PRTG helps optimize IT department resources by providing the right tools for efficient network oversight. Automation capabilities reduce manual monitoring tasks, allowing your IT team to focus on strategic initiatives. Comprehensive dashboards provide at-a-glance visibility into system health, helping prioritize maintenance activities. Our proactive monitoring approach identifies potential issues before they cause downtime, reducing emergency troubleshooting. By offering insights into resource utilization, PRTG helps align IT infrastructure with business needs and justifies technology investments. Whether you choose in-house monitoring or outsourcing to a help desk provider, PRTG provides the visibility needed to make informed decisions about your IT infrastructure.
In PRTG, “sensors” are the basic monitoring elements. One sensor usually monitors one measured value in your network, for example the traffic of a switch port, the CPU load of a server, or the free space on a disk drive. On average, you need about 5-10 sensors per device or one sensor per switch port.
Paessler conducted trials in over 600 IT departments worldwide to tune its network monitoring software closer to the needs of sysadmins. The result of the survey: over 95% of the participants would recommend PRTG – or already have.

Paessler PRTG is used by companies of all sizes. Sysadmins love PRTG because it makes their job a whole lot easier.
Bandwidth, servers, virtual environments, websites, VoIP services – PRTG keeps an eye on your entire network.
Everyone has different monitoring needs. That’s why we let you try PRTG for free.