Custom alerts and data visualization let you quickly identify and prevent unauthorized access and performance issues.
How can you maintain visibility across complex Linux network infrastructure? With the PRTG multi-platform probe, you can extend powerful monitoring capabilities to your Linux environment without installing agents on every device, giving you comprehensive insights into network performance, security vulnerabilities, and device status through a single interface.
Transform complex network data into actionable insights with customizable dashboards that display all critical metrics in one place. Monitor your Linux network infrastructure alongside Windows systems for complete visibility. Create tailored views that highlight the information that matters most to your network security monitoring needs.
Respond to potential issues before they affect your operations by setting up instant notifications when predefined thresholds are exceeded. Configure alerts based on port monitoring metrics indicating potential security breaches or performance bottlenecks. Receive notifications through multiple channels, including email, text message, or push notifications to the mobile app.
Analyze historical data to identify patterns and optimize your Linux network for maximum efficiency and security. Track bandwidth usage, response times, and resource utilization to prevent monitoring issues caused by bandwidth bottlenecks before they occur. Compare current performance against baselines to quickly spot anomalies.
Use auto-discovery to discover every device and service running on your Linux network and map your entire infrastructure. Identify unauthorized devices, open ports, and potential vulnerabilities without disrupting operations. Efficiently scan IP ranges to maintain an accurate inventory of all network assets in your Linux environment.
Diagnose network issues by continuously tracking device status, network traffic and system resources. Show server performance and other key metrics in real time. Visualize monitoring data in clear graphs and dashboards to identify problems more easily. Gain the overview you need to troubleshoot service outages and performance degradation.

Device tree view of the complete monitoring setup

Custom PRTG dashboard for keeping an eye on the entire IT infrastructure

Live traffic data graph in PRTG
“All-around winning
network monitor”
“The real beauty of PRTG is the endless possibilities it offers”
“PRTG Network Monitor
is very hard to beat”
Linux networks can be notoriously difficult to monitor, especially in mixed environments. When critical services suddenly go offline, tracking down the root cause often feels like searching for a needle in a haystack. Without proper visibility, security vulnerabilities can remain undetected for months, while performance bottlenecks frustrate users and slow down business operations.
Choose the subscription model that perfectly fits your current needs without overpaying for unused capacity. Scale up or down as your network grows or changes, with transparent pricing that makes budgeting straightforward through subscription-based monitoring. Avoid the shock of unexpected costs with a clear licensing structure that gives you complete control.
Deploy multi-platform probes throughout your network to monitor isolated segments and remote locations from a central console. Overcome firewall limitations and network segregation challenges by placing monitoring components exactly where they are needed. Maintain comprehensive monitoring across complex, multi-site Linux environments with minimal bandwidth overhead.
Access knowledgeable assistance whenever you encounter setup challenges or need help optimizing your Linux network monitoring configuration. Tap into extensive documentation, active user forums, and direct support channels staffed by technical experts who understand Linux environments. Resolve issues quickly with a support team that consistently receives high satisfaction ratings from customers worldwide.
Extend PRTG native capabilities with your own monitoring scripts tailored to your unique Linux network monitoring environment requirements. Use your existing bash, Python, or Perl scripts by integrating them directly into PRTG, or find ready-made scripts on the PRTG Sensor Hub. Monitor proprietary applications or specialized hardware that requires custom approaches while maintaining a unified SSH monitoring interface.
PRTG comes with more than 250 native sensor types for monitoring your entire on-premises, cloud, and hybrid cloud environment out of the box. Check out some examples below!
The SSH Script v2 sensor connects to a Linux/Unix system via Secure Shell (SSH) and executes a script file that is located on the target system. This option is available as part of the PRTG API. It can show the following:
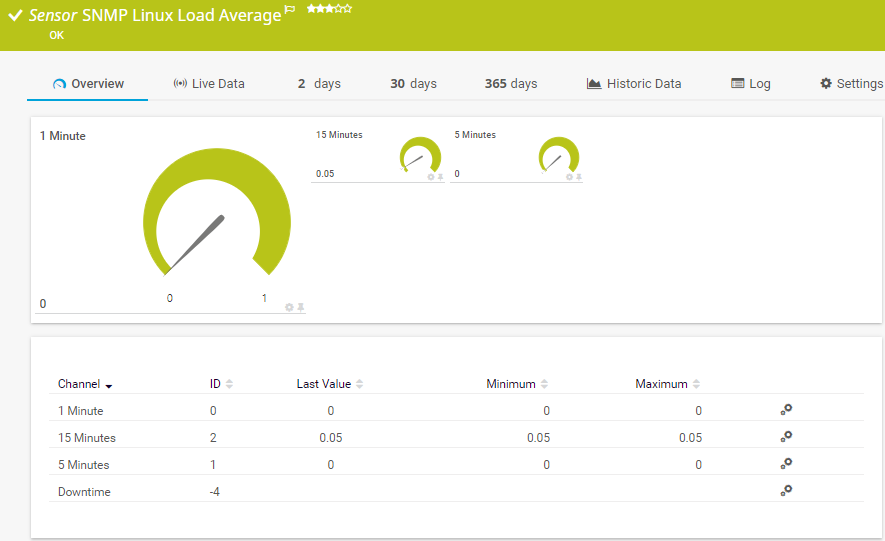
The SNMP Linux Load Average sensor monitors the system load average of a Linux/Unix system. It can show the following:
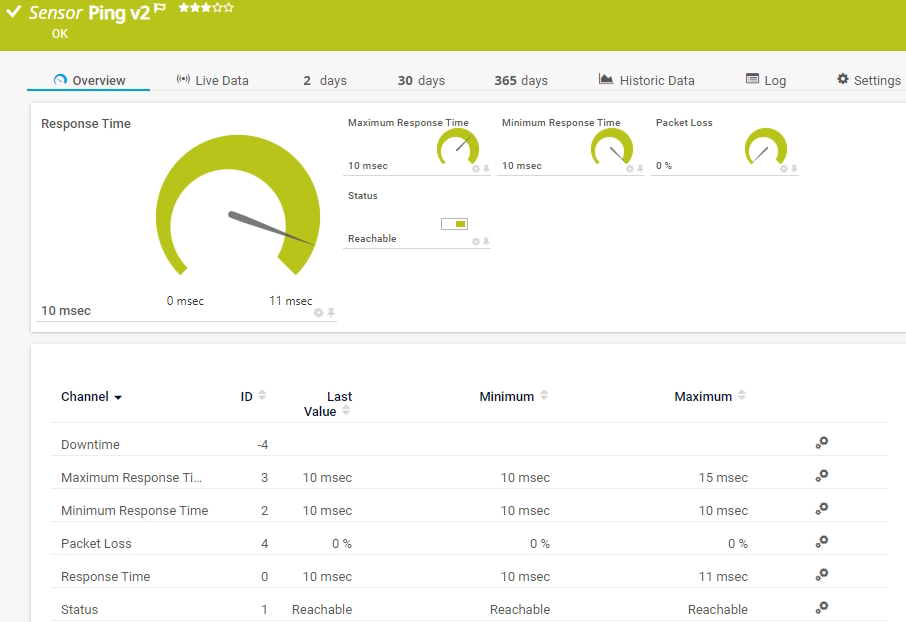
The Ping v2 sensor sends an Internet Control Message Protocol (ICMP) echo request ("ping") from the probe system to the parent device to monitor its availability. It can show the following:
• Response time
• Packet loss
• Target status
• Minimum and maximum ping time
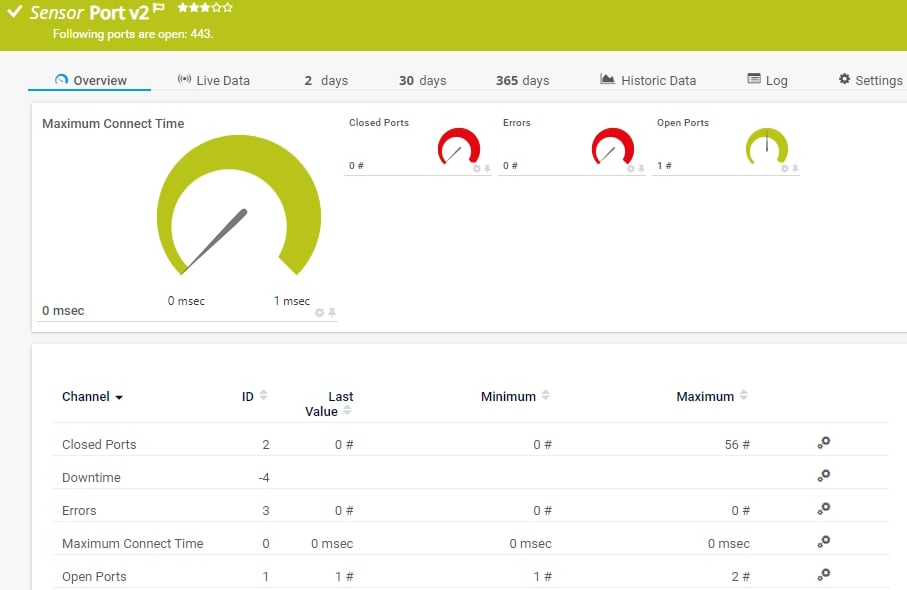
The Port v2 sensor monitors a network service by connecting to one or more of its TCP/IP ports. It can show the following:
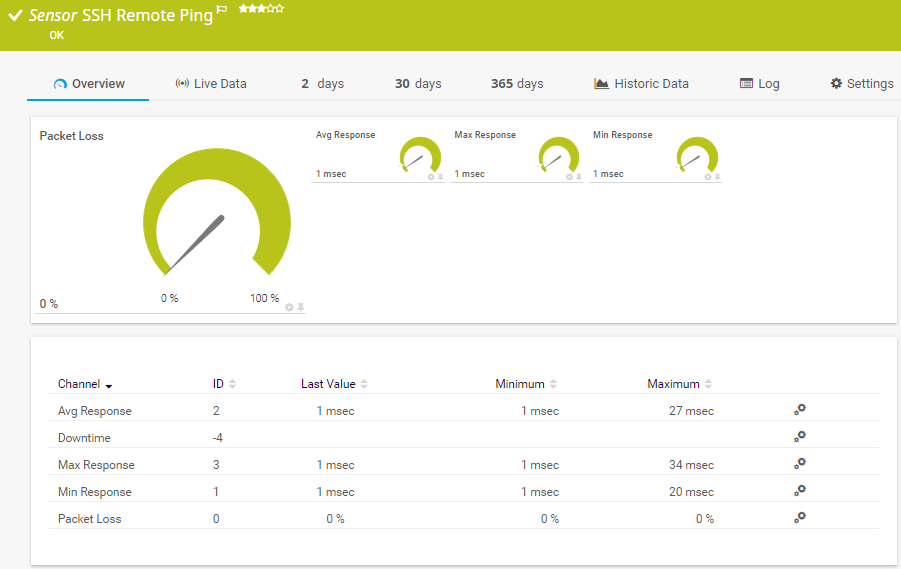
The SSH Remote Ping sensor remotely monitors the connectivity between a system running Linux/macOS X and another device, using Internet Control Message Protocol (ICMP) echo requests ("ping") and Secure Shell (SSH). It can show the following:
See the PRTG Manual for a list of all available sensor types.

Custom alerts and data visualization let you quickly identify and prevent network outages and security threats.
PRTG is set up in a matter of minutes and can be used on a wide variety of mobile devices.


“Excellent tool for detailed monitoring. Alarms and notifications work greatly. Equipment addition is straight forward and server initial setup is very easy. ...feel safe to purchase it if you intend to monitor a large networking landscape.”
Partnering with innovative IT vendors, Paessler unleashes synergies to create
new and additional benefits for joined customers.
With ScriptRunner Paessler integrates a powerful event automation platform into PRTG Network Monitor.
baramundi and PRTG create a secure, reliable and powerful IT infrastructure where you have everything under control - from the traffic in your firewall to the configuration of your clients.
Combine the functionality of Sigfox and Paessler for the most comprehensive, cost-effective, and easy-to-use IoT solution available.
Real-time notifications mean faster troubleshooting so that you can act before more serious issues occur.
Network Monitoring Software – Version 25.3.110.1313 (August 27, 2025)
Download for Windows and cloud-based version PRTG Hosted Monitor available
English, German, Spanish, French, Portuguese, Dutch, Russian, Japanese, and Simplified Chinese
Network devices, bandwidth, servers, applications, virtual environments, remote systems, IoT, and more
Choose the PRTG Network Monitor subscription that's best for you
A Linux network scanning tool is software that helps you discover and analyze devices on a network. Popular options include Nmap (network mapper), Angry IP Scanner, and PRTG with its multi-platform probe. These tools scan IP addresses, identify open ports, detect operating systems, and map your local network topology. Most Linux distributions like Ubuntu, Debian, and RedHat include command-line tools for network scanning, while some also offer GUI interfaces for easier use.
While Nmap (network mapper) is a popular open source command-line tool run with sudo privileges to scan subnets, PRTG offers a more comprehensive solution with a user-friendly interface. Both detect operating systems and identify MAC addresses, but PRTG goes beyond Nmap's capabilities with real-time monitoring and visual dashboards. Unlike Nmap, which requires consulting its man page for advanced features, PRTG provides intuitive configuration across Linux, macOS, and Microsoft Windows, making it more accessible for network administrators who prefer GUI-based tools over command-line utilities.
While Angry IP Scanner (also called IPscan) is a lightweight open source tool from GitHub that offers basic scanning with a simple GUI, PRTG delivers enterprise-grade monitoring capabilities. Both scan IP ranges and detect MAC addresses, but where IPscan provides basic hostname identification across Ubuntu and Debian systems, PRTG offers continuous monitoring with alerts and historical data analysis. Network administrators might appreciate IPscan's portability across macOS and Microsoft Windows, but PRTG's comprehensive dashboard, auto-discovery, and extensive reporting capabilities make it significantly more powerful for ongoing network management rather than just one-time diagnostics.
Yes, PRTG can monitor Linux systems effectively using its multi-platform probe technology. This allows you to extend monitoring capabilities to Linux environments without installing agents on every device. PRTG can scan networks to discover devices, monitor open ports, track bandwidth usage, and detect operating systems across your network infrastructure. The solution works with various Linux distributions including Ubuntu, Debian, RedHat, and FreeBSD, providing comprehensive monitoring for mixed environments.
PRTG uses multiple protocols to scan and monitor Linux networks. It supports SNMP for basic monitoring, SSH for secure command-line tool execution, and ARP for discovering devices on local networks. The platform can monitor TCP/UDP ports, track wifi performance, and check router connectivity. PRTG can also use advanced features like packet sniffing to analyze network traffic in detail. This multi-protocol approach ensures comprehensive visibility across your entire Linux network infrastructure.
Setting up network scanning for Linux devices with PRTG is straightforward. First, install the multi-platform probe on a Linux system (supports Ubuntu, Debian, and other distributions). Configure the probe to connect to your PRTG server, then use the auto-discovery function to scan your subnet and identify all network devices. PRTG will detect hostnames, operating systems, and open ports. For advanced scanning, you can integrate custom scripts or use the built-in sensors designed for Linux monitoring. The web interface provides an intuitive GUI for managing all your monitoring tasks.
PRTG offers numerous advanced features for Linux network scanning. The platform provides real-time monitoring of network devices, custom dashboards for visualizing scan results, and automated alerts for security issues. You can create detailed maps of your network topology, including routers and wifi access points. PRTG allows integration with other tools like nmap through custom sensors, and supports Zenmap-like visualization of network scans. The solution also offers comprehensive tutorials for setting up specialized monitoring functions tailored to Linux environments across different distributions like Ubuntu, Debian, and FreeBSD.
In PRTG, “sensors” are the basic monitoring elements. One sensor usually monitors one measured value in your network, for example the traffic of a switch port, the CPU load of a server, or the free space on a disk drive. On average, you need about 5-10 sensors per device or one sensor per switch port.
Paessler conducted trials in over 600 IT departments worldwide to tune its network monitoring software closer to the needs of sysadmins. The result of the survey: over 95% of the participants would recommend PRTG – or already have.

Paessler PRTG is used by companies of all sizes. Sysadmins love PRTG because it makes their job a whole lot easier.
Bandwidth, servers, virtual environments, websites, VoIP services – PRTG keeps an eye on your entire network.
Everyone has different monitoring needs. That’s why we let you try PRTG for free.