- English
- Deutsch
- Español
- Français
- Italiano
- Português
It is no great news that in a world where more and more data is being created day by day, the question of where to store this data becomes even more important. Storage systems should be reliable, provide availability as well as accessibility, have enough capacity to store large amounts of data, work efficiently at all times, and provide a high level of security, of course.
So what does this mean for monitoring your storage environment? In this How-to, we want to show you the steps to set up your device tree for storage monitoring based on our new native Dell EMC Unity sensors.
Get full visibility with real-time dashboards, alerts, and customizable sensors
First of all, think about what monitoring your individual storage stack implies. Usually, monitoring a storage environment does not mean that you only monitor aspects like the health status and free space of physical and logical disks or volumes. Data storage also needs a reliable underlying hardware system, and the available bandwidth plays an important role for the performance of a storage system as well.
Therefore, you should ask yourself:
In the following sections, we want to show you an example setup for monitoring a Dell EMC Unity storage system with our new native Dell EMC Unity sensors via the REST API.
Of course, PRTG also offers native sensors for other leading manufacturers such as NetApp, QNAP, Synology, HPE, Nutanix, Lenovo, or Buffalo, and some WMI sensors for monitoring your Windows storage. For an overview of storage sensors, see the PRTG Manual: List of Available Sensor Types. You can also find scripts for custom sensors in the PRTG Sensor Hub.

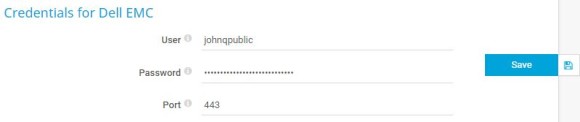
Make sure that you provide the credentials that are required for monitoring your storage system, for example, credentials for SNMP devices, Windows systems, or a specific vendor. For our example, you need to provide credentials for Dell EMC in the settings of the parent device or group.
Did you know that you can choose from various vendor device icons to enhance your device’s visualization in the device tree? Just choose a suitable device icon in the Add Device dialog.
Custom alerts and data visualization let you quickly identify and prevent all kinds of issues
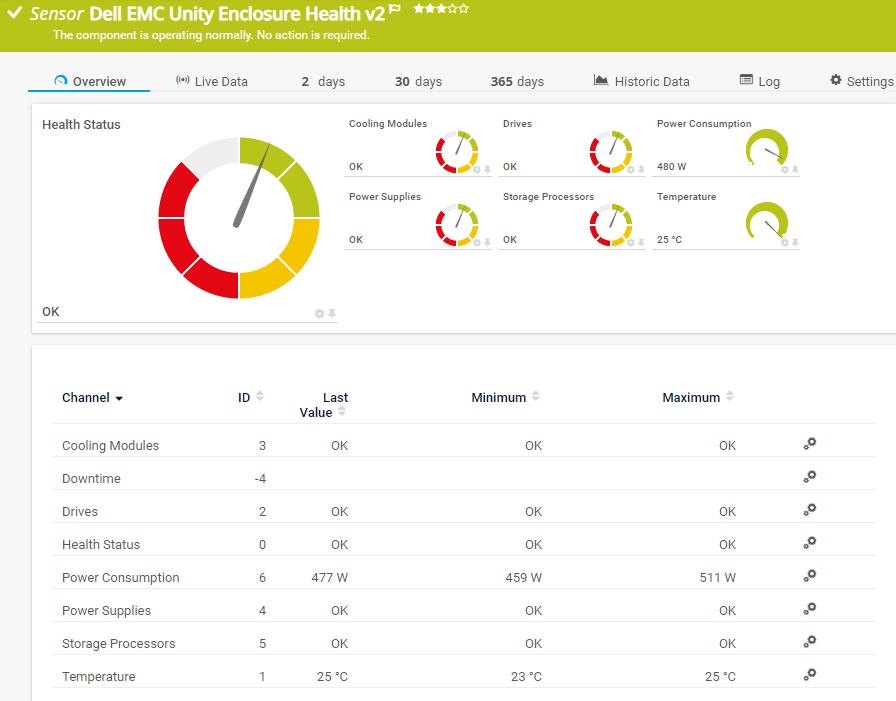
Dell EMC Unity Enclosure Health v2 sensor
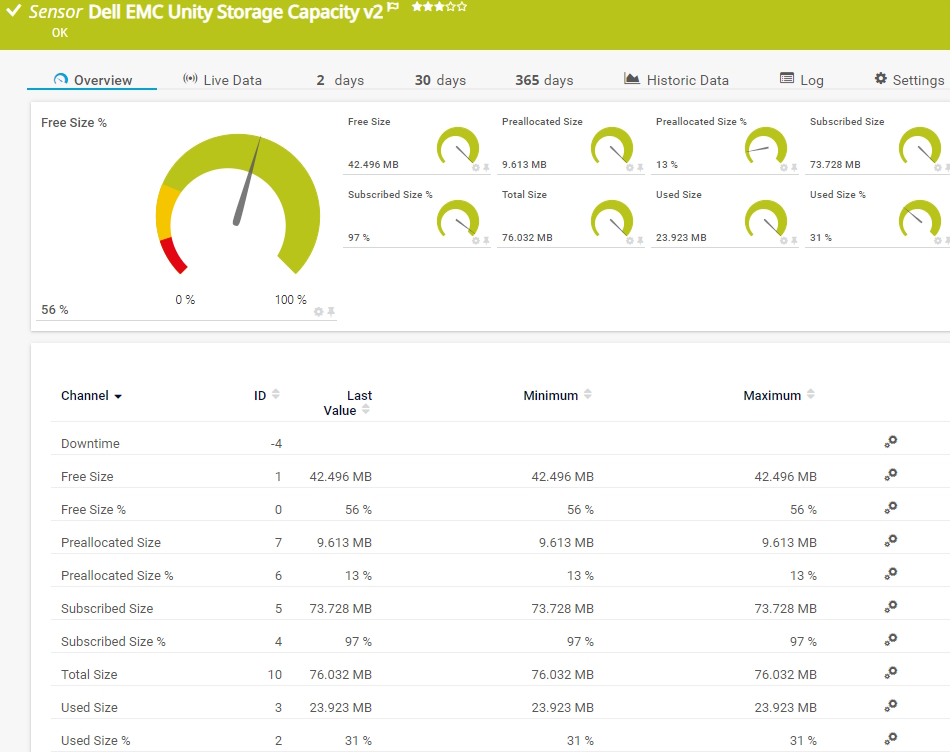
Dell EMC Unity Storage Capacity v2 sensor
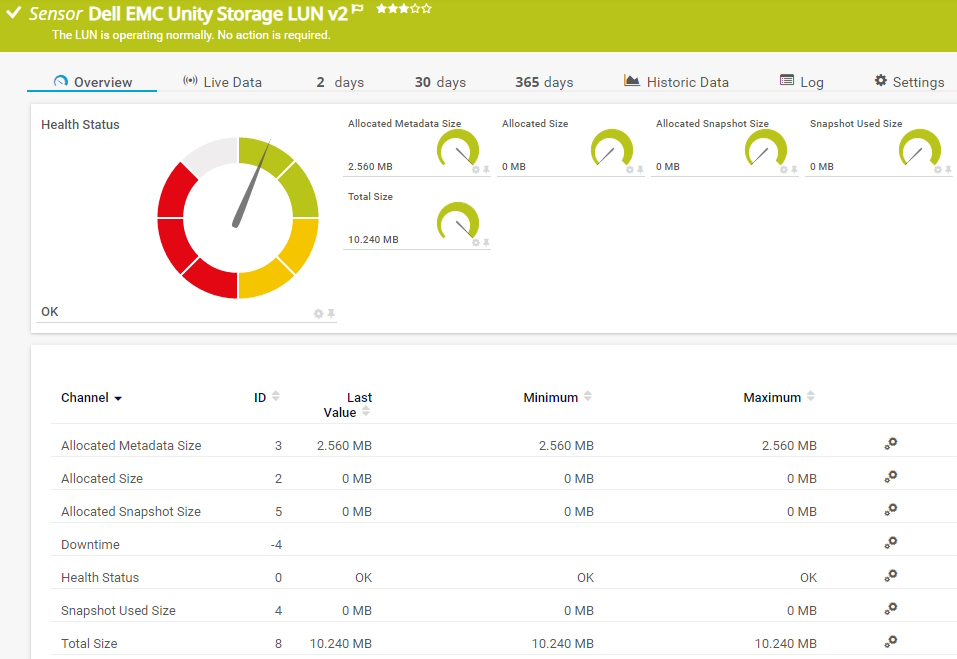
Dell EMC Storage LUN v2 sensor
4. Now you can add the sensors you need. To add a sensor to a device, right-click the device name and select Add Sensor from the context menu. We chose the following sensors:
a) Dell EMC Unity Enclosure Health v2 sensor: This sensor monitors the DAE (disk-array enclosure) health or the health of a virtual or physical DPE (disk processor enclosure). It can show, for example, the overall health status, the status of cooling modules, drives, storage processors, power supplies, or the temperature of a storage enclosure.
b) Dell EMC Unity Storage Capacity v2 sensor: This sensor can show the free size, the allocated size, the subscribed size, and the used size of the storage system in percent and bytes.
c) Dell EMC Unity Storage Pool v2 sensor: This sensor can show the overall health status of a storage pool, the free size, the metadata size (used and subscribed), the preallocated size, the snapshot size (used and subscribed), the subscribed size, and the used size in percent and bytes.
d) Dell EMC Unity Storage LUN v2 sensor: This sensor can show the overall health status of a storage LUN, the allocated size, the allocated metadata size, and the used and allocated snapshot size.
e) Dell EMC Unity File System v2 sensor: This sensor can show the free size in percent and bytes, the allocated size, the snapshot count, and the used snapshot size of a file system.
Are you missing a sensor to monitor, for example, the I/O performance of your Dell EMC Unity storage system? Stay tuned for further upcoming native sensors!
The complete setup can look as follows:
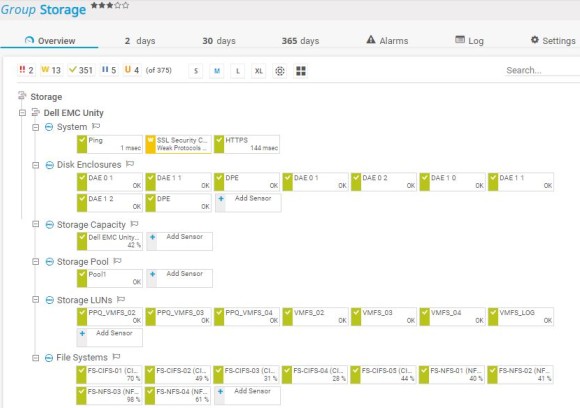
Of course, this is only one possibility of many when you think of setting up your storage monitoring. All in all, your specific monitoring setup always depends on the specific storage system you use and the technology that it supports. For a device tree setup of storage monitoring via SNMP, see also the example at the end of this article.
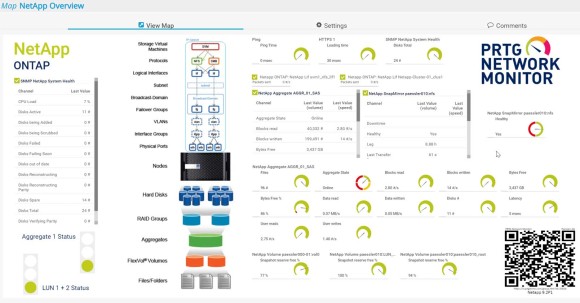
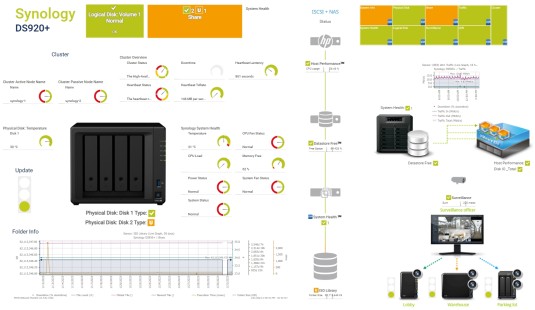
With the Maps feature in PRTG, you can create customized dashboards to display your storage monitoring data in a graphically appealing way. See the following screenshots of example dashboards for monitoring a NetApp ONTAP storage system and a Synology storage system:
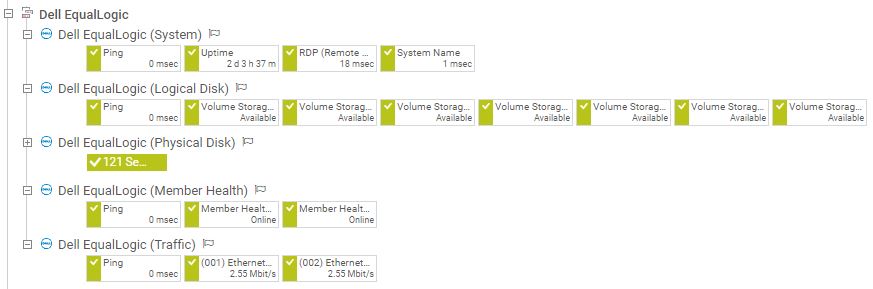
Here you can find a possible setup for your storage monitoring via SNMP. For our example, we chose the Dell EqualLogic storage system.
We set up the following devices according to the different monitoring layers: Dell EqualLogic (System), Dell EqualLogic (Logical Disk), Dell EqualLogic (Physical Disk), Dell EqualLogic (Member Health), and Dell EqualLogic (Traffic).
Then we added the following sensors:
Dell EqualLogic (System)
Dell EqualLogic (Logical Disk)
Dell EqualLogic (Physical Disk)
Dell EqualLogic (Member Health)
Dell EqualLogic (Traffic)
The complete setup can look as follows: