• Company
    • About Us
    • Case Studies
    • Press Center
    • Events
    • Careers
    • Blog
    • Contact us
  • Contact us
  • Login
 
  • English
    • Deutsch
    • Español
    • Français
    • Italiano
    • Português
Paessler
                    - The Monitoring Experts
  • Products
    • Paessler PRTG
      Paessler PRTGMonitor your whole IT infrastructure
      • PRTG Network Monitor
      • PRTG Enterprise Monitor
      • PRTG Hosted Monitor
      • PRTG extensionsExtensions for Paessler PRTGExtend your monitoring to a new level
    • Icon Features
      FeaturesExplore all monitoring features
      • Maps & dashboards
      • Alerts & notifications
      • Multiple user interfaces
      • Distributed monitoring
      • Customizable reporting
  • Solutions
    • Industries
      IndustriesMonitor various industry sectors
      • Industrial
      • Healthcare
      • Data Center
      • Education
      • Finance
      • Government
    • IT Topics
      IT TopicsMonitor all areas of IT
      • Network Monitoring
      • Bandwidth Monitoring
      • SNMP Monitor
      • Network Mapping
      • WiFi Monitoring
      • Server Monitoring
  • Pricing
  • Resources
    • Getting Started
      Getting StartedModules for self-paced learning
    • How-to Guides
      How-to GuidesGet the most out of PRTG
    • Videos & Webinars
      Videos & WebinarsLearn from Paessler experts
    • IT  Knowledge
      IT KnowledgeExpand your IT knowledge
    • PRTG Manual
      PRTG ManualFull documentation
    • Knowledge Base
      Knowledge BaseShare community knowledge
    • PRTG Sensor Hub
      PRTG Sensor HubGet sensors, scripts & templates
    • Trainings
      PRTG TrainingLearn how to work with PRTG
  • Partners
    • icon star
      New Partners and MSPBecome a new partner or MSP
    • icon partner
      Partner PortalLog in to your partner account
    • Deal Registration
      Deal RegistrationRegister your sales opportunities
    • icon search
      Find a PartnerFind partners selling Paessler products
    • icon technology
      Technology AlliancesSee Paessler technology partnerships
  • Company
    • About Us
    • Case Studies
    • Press Center
    • Events
    • Careers
    • Blog
    • Contact us
  • Contact us
  • Login
  • English
    • Deutsch
    • Español
    • Français
    • Italiano
    • Português
  • Get a quote
  • Free trial
  1. Home>
  2. Resources>
  3. How-to Guides>
  4. How to install a classic remote probe for PRTG Network Monitor in 4 steps
PRTG Logo

How to install a classic remote probe for PRTG Network Monitor in 4 steps

Free download
product overview

Installing a classic remote probe for PRTG Network Monitor: Step-by-Step Guide

Table of content
  • Prepare the PRTG core server
  • Download the classic remote probe installer
  • Install the remote probe
  • Approve the new remote probe and start monitoring

Bring your monitoring experience to the next level with PRTG

Get full visibility with real-time dashboards, alerts, and customizable sensors

Free download
PRODUCT OVERVIEW
PRTG Infographic multi probe

What is a remote probe?

With remote probes, you can monitor different subnetworks that are separated from your PRTG core server system by a firewall to keep an eye on remote locations. You can install one or more remote probes.

Remote probes are also useful if you want to distribute monitoring load by taking it from the PRTG core server system and putting it on one or more remote probe systems.

Please note that the following steps refer to PRTG Network Monitor. For PRTG Hosted Monitor, different rules apply.


Prepare the PRTG core server

  1. From the main menu in the PRTG web interface, select Setup | System Administration | Core & Probes and go to section Probe Connection Settings.
  2. By default, PRTG a core server accepts connections from the Local probe only, 127.0.0.1. This setting is the most secure setting, but it does not allow any remote probes to connect to your PRTG core server. To accept remote probes, select All IP addresses available on this computer. This way, any IP address on your PRTG core server system accepts incoming probe connections.
  3. In the Allow IP Addresses field, enter the IP address of the computer that you want to install a remote probe on.
  4. Enter the word any to set the PRTG core server to accept remote probes that connect from any IP address.
    Note: If you use any, make sure you write the word in lowercase only. Any other variations are invalid.
  5. Leave all other settings as they are and click Save.
  6. PRTG now needs to restart the PRTG core server to apply your changes. After clicking Save, a dialog box appears that asks you to confirm the required PRTG core server restart. Click OK to trigger the restart and follow the instructions.
PRTG Screenshot Probe connection settings

Download the classic remote probe installer

icon number one

Log in to the PRTG web interface

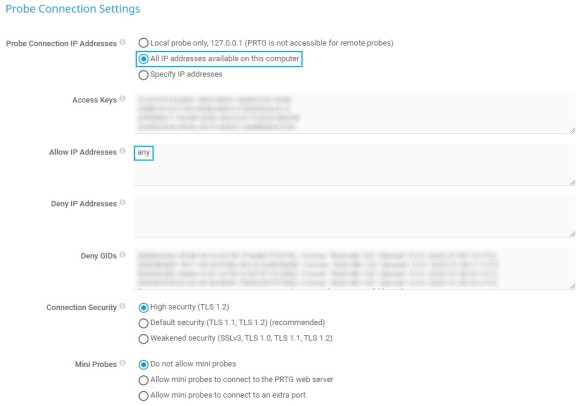
On the system that you want to install a remote probe on, log in to the PRTG web interface.

icon number two

Add remote probe

  • From the main menu bar, select Setup | Optional Downloads | Remote Probe Installer.
  • Click Add Classic Remote Probe to start the installation assistant.
icon number three

Prepare and download

  • In the dialog that appears, click Prepare and Download to start the download of the installer.
  • Save the setup program to your local disk.

Add remote probe

PRTG Screenshot Classic Remote Probe Installer

Prepare and download

PRTG Screenshot Download window

PRTG makes monitoring as easy as it gets

Custom alerts and data visualization let you quickly identify and prevent all kinds of issues

Free download
PRODUCT OVERVIEW

Install the remote probe

icon number one

Execute setup program

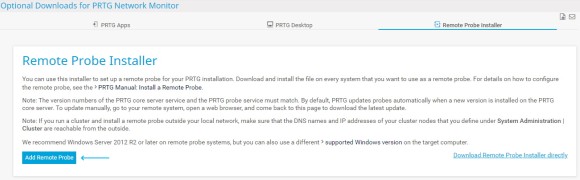
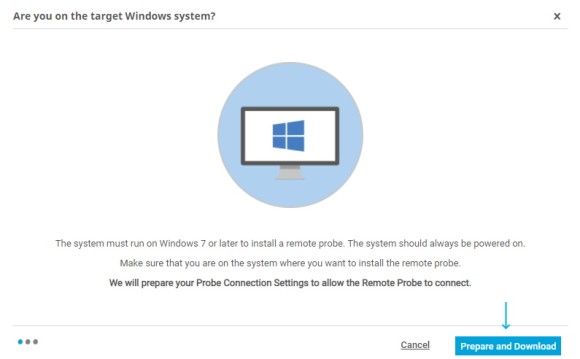
Execute the setup program that you downloaded.

icon number two

 Confirm Windows dialog

  • Confirm the Windows User Account Control dialog with Yes to allow the installation.
  • The usual software installation wizard will guide you through the installation process.
icon number three

Start installation process

  • Click Install to start the installation process of your remote probe.
  • Wait until the installation is completed. The remote probe automatically connects to your PRTG core server.
  • If the remote probe successfully connected to your PRTG core server, you can complete the setup of your new remote probe.
icon number four

Finalize installation

  • Click Continue to finish the remote probe installation.
  • Finally, click Finish to exit the installation wizard.
  • The remote probe is now installed on your system as a Windows service.
PRTG Screenshot installation process

Start installation process

PRTG Screenshot installation of remote probe

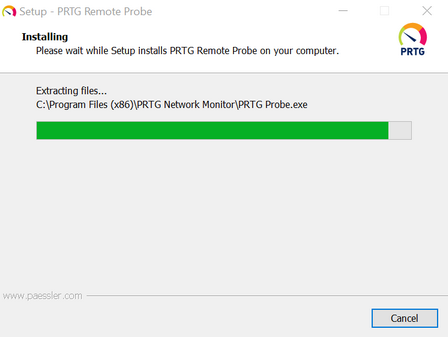
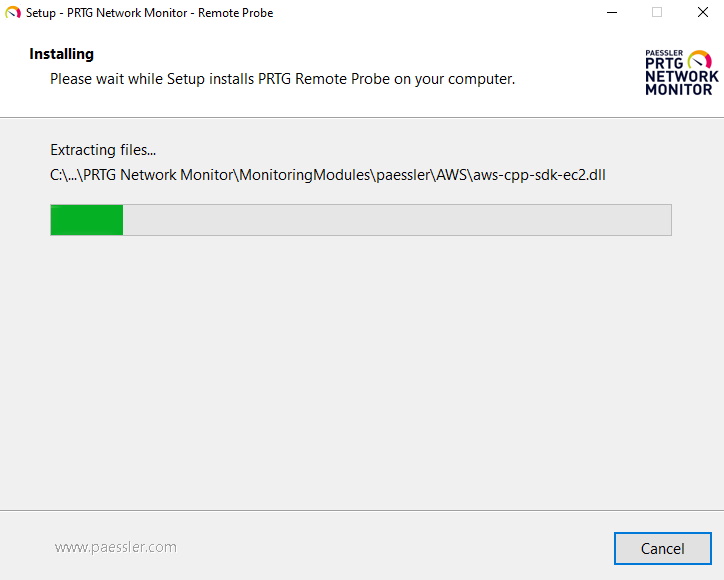
Install remote probe

PRTG Screenshot successful installation

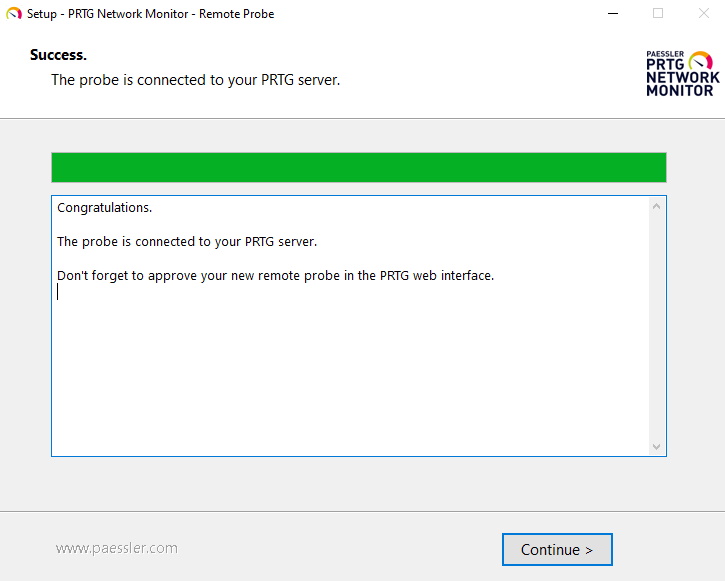
Successful installation

Approve the new remote probe and start monitoring

PRTG Screenshot installation done

Installation done

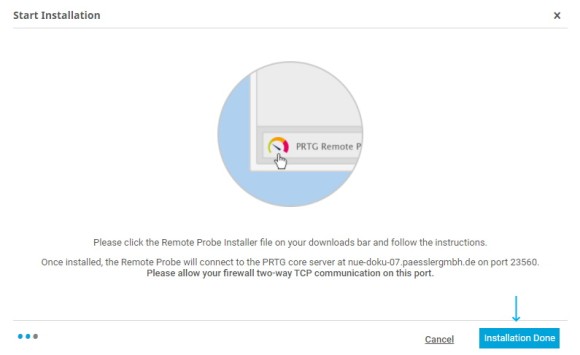
In the installation assistant, click Installation Done

PRTG Screenshot approbe new remote probe

Approve and auto-discover

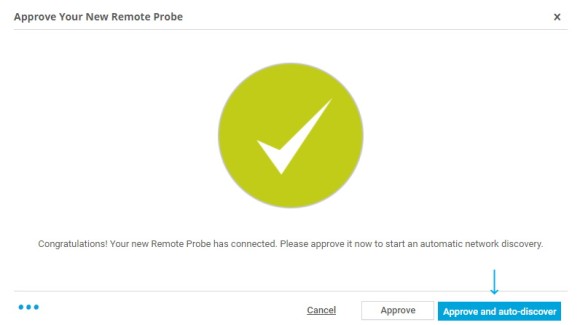
Click Approve and auto-discover to include your new classic remote probe device and network in your device tree and to start the PRTG auto-discovery. It helps you discover devices and automatically creates suitable sensors.

Optionally, you can also choose to only approve your remote probe without starting an auto-discovery by clicking Approve.

The remote probe appears as a new object in your device tree. You can now create groups, devices, and sensors to start monitoring.

This how-to guide only scratches the surface?

Get more deep-dive information here!

Preview resource section

Distributed monitoring with PRTG simply explained

view more
Preview knowledge base

In our Knowledge Base, you get information about remote probes

Read more
Preview manual

Our manual describes remote probe installation in detail

READ more
PRTG Logo

Start monitoring your IT infrastructure for free with PRTG and see how it can make your network more reliable and your job easier.

Free download
PRODUCT OVERVIEW

Products

  • Paessler PRTG
    Paessler PRTGMonitor your whole IT infrastructure
    • PRTG Network Monitor
    • PRTG Enterprise Monitor
    • PRTG Hosted Monitor
    • PRTG extensions
      Extensions for Paessler PRTGExtend your monitoring to a new level
  • Icon Features
    FeaturesExplore all monitoring features

Monitoring with PRTG

  • Network monitoring
  • Bandwidth monitoring
  • SNMP monitoring
  • Network mapping
  • Wi-Fi monitoring
  • Server monitoring
  • Network traffic analyzer
  • NetFlow monitoring
  • Syslog server

Useful Links

  • PRTG Manual
  • Knowledge Base
  • Customer Success Stories
  • About Paessler
  • Subscribe to newsletter
  • PRTG Support
  • PRTG Consulting
  • PRTG Feedback & Roadmap

Contact

Paessler GmbH
Thurn-und-Taxis-Str. 14, 
90411 Nuremberg 
Germany

[email protected]

+49 911 93775-0

  • Contact us
©2025 Paessler GmbHTerms & ConditionsPrivacy PolicyImprintReport VulnerabilityDownload & InstallSitemap
Application Performance Monitoring Tool Application Performance Monitoring Tool Application Performance Monitoring Tool