• Company
    • About Us
    • Case Studies
    • Press Center
    • Events
    • Careers
    • Blog
    • Contact us
  • Contact us
  • Login
 
  • English
    • Deutsch
    • Español
    • Français
    • Italiano
    • Português
Paessler
                    - The Monitoring Experts
  • Products
    • Paessler PRTG
      Paessler PRTGMonitor your whole IT infrastructure
      • PRTG Network Monitor
      • PRTG Enterprise Monitor
      • PRTG Hosted Monitor
      • PRTG extensionsExtensions for Paessler PRTGExtend your monitoring to a new level
    • Icon Features
      FeaturesExplore all monitoring features
      • Maps & dashboards
      • Alerts & notifications
      • Multiple user interfaces
      • Distributed monitoring
      • Customizable reporting
  • Solutions
    • Industries
      IndustriesMonitor various industry sectors
      • Industrial
      • Healthcare
      • Data Center
      • Education
      • Finance
      • Government
    • IT Topics
      IT TopicsMonitor all areas of IT
      • Network Monitoring
      • Bandwidth Monitoring
      • SNMP Monitor
      • Network Mapping
      • WiFi Monitoring
      • Server Monitoring
  • Pricing
  • Resources
    • Getting Started
      Getting StartedModules for self-paced learning
    • How-to Guides
      How-to GuidesGet the most out of PRTG
    • Videos & Webinars
      Videos & WebinarsLearn from Paessler experts
    • IT  Knowledge
      IT KnowledgeExpand your IT knowledge
    • PRTG Manual
      PRTG ManualFull documentation
    • Knowledge Base
      Knowledge BaseShare community knowledge
    • PRTG Sensor Hub
      PRTG Sensor HubGet sensors, scripts & templates
    • Trainings
      PRTG TrainingLearn how to work with PRTG
  • Partners
    • icon star
      New Partners and MSPBecome a new partner or MSP
    • icon partner
      Partner PortalLog in to your partner account
    • Deal Registration
      Deal RegistrationRegister your sales opportunities
    • icon search
      Find a PartnerFind partners selling Paessler products
    • icon technology
      Technology AlliancesSee Paessler technology partnerships
  • Company
    • About Us
    • Case Studies
    • Press Center
    • Events
    • Careers
    • Blog
    • Contact us
  • Contact us
  • Login
  • English
    • Deutsch
    • Español
    • Français
    • Italiano
    • Português
  • Get a quote
  • Free trial
  1. Home>
  2. Resources>
  3. How-to Guides>
  4. How to use push monitoring via HTTP
PRTG Logo

How to use push monitoring via HTTP

Free download
product overview

Using push monitoring via HTTP with PRTG: Step-by-Step Guide

Table of content
  • Use cases for HTTP push monitoring
  • PRTG sensors for HTTP push monitoring
  • How to set up HTTP push monitoring
  • Configure an external device to point to PRTG

Push monitoring via HTTP means to monitor data that a device automatically sends to PRTG with the help of different HTTP Push sensors. For push monitoring, webhooks are used to push messages from devices with specifically configured callbacks to PRTG using HTTP. Webhooks are actions triggered by an event that send the requested information to a specific URL in real time.

Use cases for HTTP push monitoring

The push technology can be useful in different cases:

  • The target device does not allow requests via the usual technologies, for example, SSH or SNMP.
  • You want to monitor web servers that can periodically run specific scripts or PHP.
  • You want to monitor Linux services. For more information, see the Knowledge Base: How can I monitor and automatically restart a service on a Linux host?
  • You want to migrate many EXE sensors into one EXE script that manages the HTTP Push sensors and sends data to them. For more information, see the Knowledge Base: How can I monitor SCVMM hosts and VMs with PRTG?
  • You want to monitor data sent by IoT devices like Sigfox sensors. For more information, see the Knowledge Base: How can I monitor Sigfox callbacks with PRTG? and How can I monitor Sigfox geolocation with PRTG?

Bring your monitoring experience to the next level with PRTG

Get full visibility with real-time dashboards, alerts, and customizable sensors

Free download
PRODUCT OVERVIEW

PRTG sensors for HTTP push monitoring

HTTP Push Count sensorThis sensor counts the number of received push messages.
HTTP Push Data sensorThis sensor shows number values from received push messages.
HTTP Push Data Advanced sensorThis sensor shows number values from received push messages, as well as the messages themselves in valid XML or JSON format.
HTTP IoT Push Data Advanced sensorThis sensor shows data from push messages received from IoT devices.

How to set up HTTP push monitoring

Add an HTTP Push sensor in PRTG

  1. Create a new device or use an existing device with the IP address of your probe system, for example, the probe device, or with the DNS name of your PRTG Hosted Monitor instance.

  2. Add an HTTP Push sensor to the new device or the probe device: right-click the respective device and select Add Sensor from the context menu. Then filter for Push Message Receiver under Technology Used?.

  3. Click the sensor that you want to add. Choose between the HTTP Push Count sensor, the HTTP Push Data sensor, the HTTP Push Data Advanced sensor, or the HTTP IoT Push Data Advanced sensor.
PRTG screenshot add sensor to device probe device window

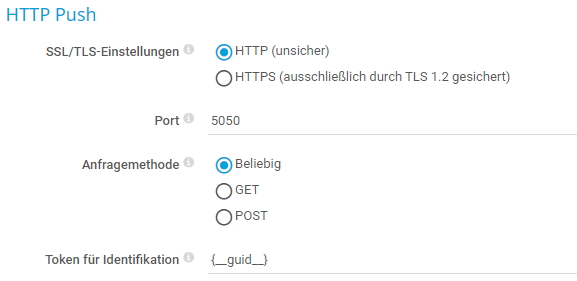
4. In section HTTP Push, define the following settings:

  • Select the security of the HTTP requests. You can choose between HTTP (unsecure) and HTTPS (secured with TLS 1.2 only).
    Note: The HTTP IoT Push Data Advanced sensor can only use HTTPS.
  • Enter the Port on which the sensor listens for HTTP requests. The default port is 5050 for HTTP and 5051 for HTTPS.
  • Choose the HTTP Request Method of the webhook. This can be ANY, GET, or POST.
    Note: The request method POST sends the XML or JSON encoded HTTP body as POST data. For POST requests, use an HTTP content type other than application/x-www-form-urlencoded. We strongly recommend that you use the HTTP content types application/xml or application/json.
  • The Identification Token is the token that PRTG uses to find the matching sensor for an incoming push message. When you create the sensor, this token is {_guid_}. PRTG replaces this value with an automatically generated token. You can also enter a custom identification token, if required.
    Note: The Identification Token setting for the HTTP IoT Push Data Advanced sensor can be found in section HTTP Push Authentication.
  • For the HTTP Push Data sensor, you also need to define the Value Type of the data that the external device sends. Choose between Integer, Float, or Counter. This setting can be found in section HTTP Push Data.
PRTG screenshot specify http push
PRTG screenshot specify http push data

PRTG makes monitoring as easy as it gets

Custom alerts and data visualization let you quickly identify and prevent all kinds of issues

Free download
PRODUCT OVERVIEW

Configure an external device to point to PRTG

To enable an external device to send push messages to the intended HTTP Push sensor in PRTG,
you need to provide the device with the URL that points to the according sensor.

HTTP Push Count sensor

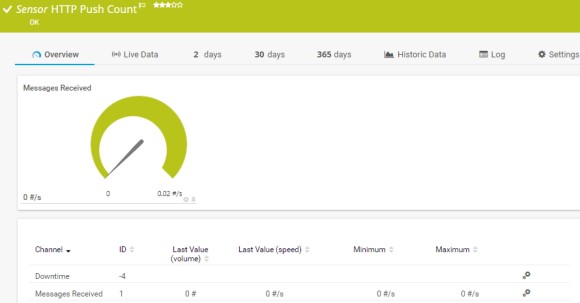
The HTTP Push Count sensor can be reached via the following URL:

http://<probe_ip_address>:<port_number>/<identification_token>

Replace the parameters with the following values:

  • The <probe_ip_address> is the IP address of the probe system that runs the sensor. For PRTG Hosted Monitor, it is the DNS name of the respective instance.
  • The <port_number> is the port that you entered during the sensor setup. You can find the port number in the sensor settings.
  • The <identification_token> is the value that you defined during the sensor setup or the default value that PRTG automatically created. You can find the identification token in the sensor settings.

Example URL: http://127.0.0.1:5050/XYZ-123

PRTG screenshot sensor HTTP Push count
A correctly configured sensor that receives push data can look like this
PRTG screenshot sensor HTTP Push count

A correctly configured sensor that receives push data can look like this

HTTP Push Data sensor

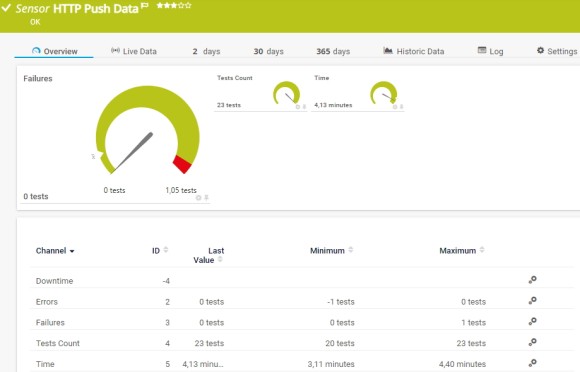
The HTTP Push Data sensor can be reached via the following URL:

http://<probe_ip_address>:<port_number>/<identification_token>?value=<integer_or_float>&text=<text_message>

Replace the parameters with the following values:

  • The <probe_ip_address> is the IP address of the probe system that runs the sensor. For PRTG Hosted Monitor, it is the DNS name of the respective instance.
  • The <port_number> is the port that you entered during the sensor setup. You can find the port number in the sensor settings.
  • The <identification_token> is the value that you defined during sensor setup or the default value that PRTG automatically created. You can find the identification token in the sensor settings.
  • The ?value parameter can be an <integer_or_float> depending on the data that your external device sends. The value that you enter here must match the value type that you specified in the sensor settings.
  • The ?text parameter is optional: you can also leave it out. For <text_message>, you can add a custom text that PRTG shows as the sensor message. The text message must be URL encoded.

Example URL: http://127.0.0.1:5050/XYZ-123 value=0&text=this%20is%20a%20sensor%20message

PRTG screenshot sensor HTTP Push count
A correctly configured sensor that receives push data can look like this
PRTG screenshot sensor HTTP Push count

A correctly configured sensor that receives push data can look like this

HTTP Push Data Advanced and HTTP IoT Push Data Advanced sensor

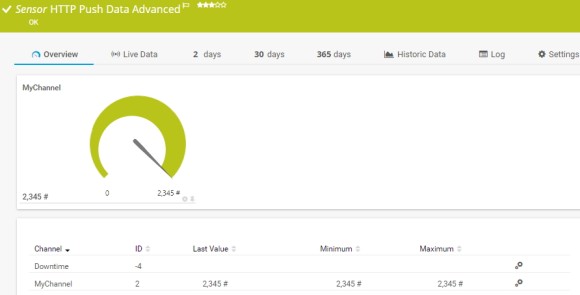
The HTTP Push Data Advanced and HTTP IoT Push Data Advanced sensors can be reached via the following URLs, depending on the type of HTTP request:

  • GET request:
    http://<probe_ip_address>:<port_number>/<identification_token>?content=<valid_XML_or_JSON>
  • POST request:
    http://<probe_ip_address>:<port_number>/<identification_token>

Replace the parameters with the following values:

  • The <probe_ip_address> is the IP address of the probe system that runs the sensor. For PRTG Hosted Monitor, it is the DNS name of the respective instance.
  • The <port_number> is the port that you entered during the sensor setup. You can find the port number in the sensor settings.
    Note: For the HTTP IoT Push Data Advanced sensor, the port is always 5051. It cannot be changed.
  • The <identification_token> is the value that you defined during sensor setup or the default value that PRTG automatically created. You can find the identification token in the sensor settings.
  • The ?content parameter for GET requests must be <valid_XML_or_JSON> and has to match the format as defined in the PRTG Manual: Custom Sensors. The content specifies custom channels and optional text messages that PRTG shows as the sensor message. The text message must be URL encoded.

Minimum example URL for a GET request:

http://127.0.01:5050/XYZ-123?content=<prtg><result><channel>MyChannel</channel><value>10</value></result><text>this%20is%20a%20sensor%20message</text></prtg>

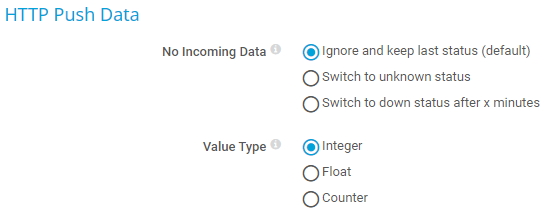
Note: By default, values within the <value> tags must be integers. If your external device returns float values, you must explicitly define this value type with <float> tags. Otherwise, the sensor shows 0 values in the respective channels.

Example: 

http://127.0.01:5050/XYZ-123?content=<prtg><result><channel>MyChannel</channel><value>10.45</value><float>1</float></result><text>this%20is%20a%20sensor%20message</text></prtg>

PRTG screenshot sensor HTTP Push Data advanced
A correctly configured sensor that receives push data can look like this
PRTG screenshot sensor HTTP Push Data advanced

A correctly configured sensor that receives push data can look like this

This how-to guide only scratches the surface?

Get more deep-dive information here!

Preview Video

Video: PRTG & Sigfox

View more
Preview knowledge base

Knowledge Base: Monitoring IoT and IIoT environments with Node-RED

READ more
PRTG Logo

Start monitoring your IT infrastructure for free with PRTG and see how it can make your network more reliable and your job easier.

Free download
PRODUCT OVERVIEW

Products

  • Paessler PRTG
    Paessler PRTGMonitor your whole IT infrastructure
    • PRTG Network Monitor
    • PRTG Enterprise Monitor
    • PRTG Hosted Monitor
    • PRTG extensions
      Extensions for Paessler PRTGExtend your monitoring to a new level
  • Icon Features
    FeaturesExplore all monitoring features

Monitoring with PRTG

  • Network monitoring
  • Bandwidth monitoring
  • SNMP monitoring
  • Network mapping
  • Wi-Fi monitoring
  • Server monitoring
  • Network traffic analyzer
  • NetFlow monitoring
  • Syslog server

Useful Links

  • PRTG Manual
  • Knowledge Base
  • Customer Success Stories
  • About Paessler
  • Subscribe to newsletter
  • PRTG Support
  • PRTG Consulting
  • PRTG Feedback & Roadmap

Contact

Paessler GmbH
Thurn-und-Taxis-Str. 14, 
90411 Nuremberg 
Germany

[email protected]

+49 911 93775-0

  • Contact us
©2025 Paessler GmbHTerms & ConditionsPrivacy PolicyImprintReport VulnerabilityDownload & InstallSitemap
Application Performance Monitoring Tool Application Performance Monitoring Tool Application Performance Monitoring Tool