Custom alerts and data visualization let you quickly identify and prevent VMware performance issues.
Your VMware environment is like the engine of your IT infrastructure - when it purrs, everything runs smoothly. But when it sputters, your entire business feels the impact. Smart monitoring isn't just about preventing fires - it's about tuning that engine for peak performance preventing those late-night emergency calls. Here are three reasons why keeping tabs on your virtual environment with PRTG is a smart move.
Your VMware vSphere environment doesn't exist in a vacuum – it powers critical applications that keep your business running. When performance issues strike, the impact can ripple across your organization. Paessler PRTG gives you the visibility you need to spot trouble before it escalates from "minor glitch" to "all hands on deck." By continuously tracking essential metrics across your ESXi hosts, vCenter Server, and virtual machines, PRTG transforms complex data into actionable insights.
Without proper monitoring, it's tempting to throw more resources at problems – but it's not a sustainable strategy. PRTG helps you become a resource optimization champion by showing exactly where your CPU, memory, and storage are being utilized. With PRTG's insightful monitoring, you can identify resource-hungry VMs, track vMotion events, and make informed decisions about your virtual infrastructure.
When users start to report problems, you need facts, not hunches. PRTG automatically builds a history of normal performance patterns in your VMware environment, creating baselines for critical metrics across your virtual infrastructure. So, when performance starts to dip, you can quickly compare current values against these baselines to identify anomalies. It's like having a performance time machine – see what changed and when, so you can resolve issues with precision instead of guessing at potential problems.
Diagnose network issues by continuously tracking the health and performance of your VMware environment. Show CPU usage, memory consumption and other key metrics in real time. Visualize monitoring data in clear graphs and dashboards to identify problems more easily. Gain the overview you need to troubleshoot performance bottlenecks, optimize resource allocation, and ensure your virtual infrastructure runs at peak efficiency.

Device tree view of the complete monitoring setup

Custom PRTG dashboard for keeping an eye on the entire IT infrastructure
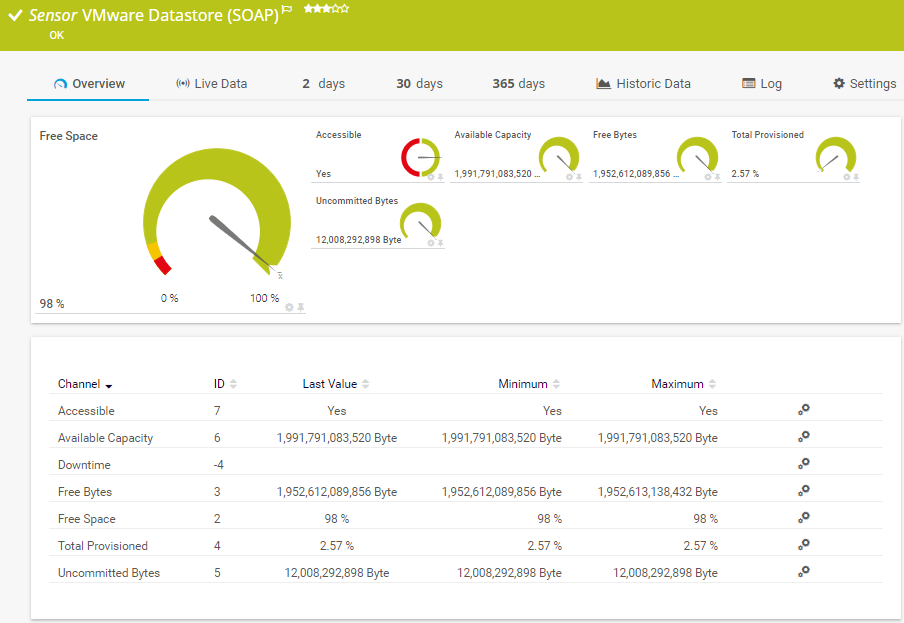
Channel data from the VMware Datatore (SOAP) Sensor in PRTG
“All-around winning
network monitor”
“The real beauty of PRTG is the endless possibilities it offers”
“PRTG Network Monitor
is very hard to beat”
Monitoring your VMware environment shouldn't need a team of specialists or hours of configuration. PRTG takes the complexity out of virtual infrastructure monitoring and replaces it with clarity and insight. With purpose-built monitoring tools designed specifically for VMware environments, PRTG turns mountains of performance data into actionable intelligence that helps you prevent issues, optimize resources, and demonstrate the value of your virtual infrastructure.
PRTG doesn't just collect data – it tells you when something needs attention, through whatever channel works best for your workflow, be it email, SMS, push notifications or even Microsoft Teams and Slack. So, you'll be the first to know when performance metrics cross thresholds letting you address issues before they escalate from "minor concern" to "major incident."
Data without context is just numbers. PRTG's customizable dashboards transform complex metrics into visual insights that make sense to both technical teams and management. Create tailored views of your VMware environment that highlight the metrics that matter most to different stakeholders. With PRTG's intuitive interface, you can craft the perfect dashboard fast.
PRTG automatically stores historical performance data, allowing you to analyze trends and patterns over time. This historical perspective is invaluable for troubleshooting intermittent issues or understanding the impact of changes to your virtual environment. By examining how performance metrics have changed over days, weeks, or months, you can identify gradual degradation, correlate performance issues with specific events, and make more informed decisions about capacity planning.
The most challenging VMware issues often involve multiple interconnected factors. PRTG allows you to monitor different performance indicators through its various sensors and view them in multiple ways, helping you identify relationships between different metrics. When users report performance issues, you can check multiple sensors monitoring CPU usage, memory usage, storage latency, and network traffic to help determine which resource might be causing the bottleneck. By having all these metrics available in one monitoring solution, you can more quickly narrow down potential causes and focus your troubleshooting efforts – helping you solve problems before they escalate into major incidents.
PRTG comes with more than 250 native sensor types for monitoring your entire on-premises, cloud, and hybrid cloud environment out of the box. Check out some examples below!
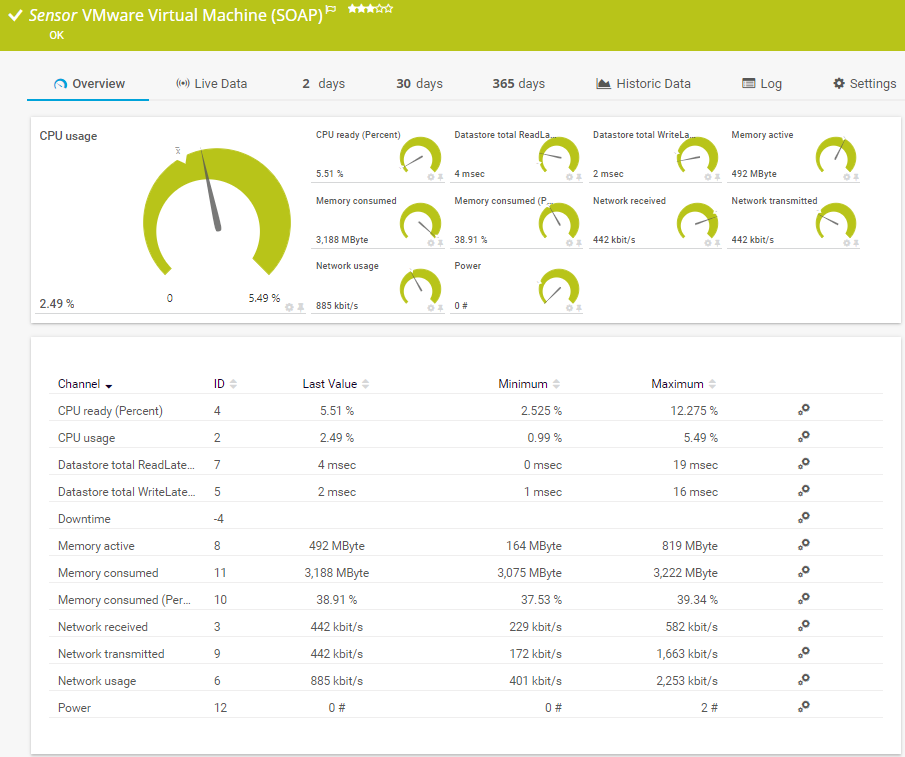
The VMware Virtual Machine (SOAP) sensor monitors a virtual machine (VM) on a VMware host server using the Simple Object Access Protocol (SOAP). It can show the following and more:
CPU readiness and usage
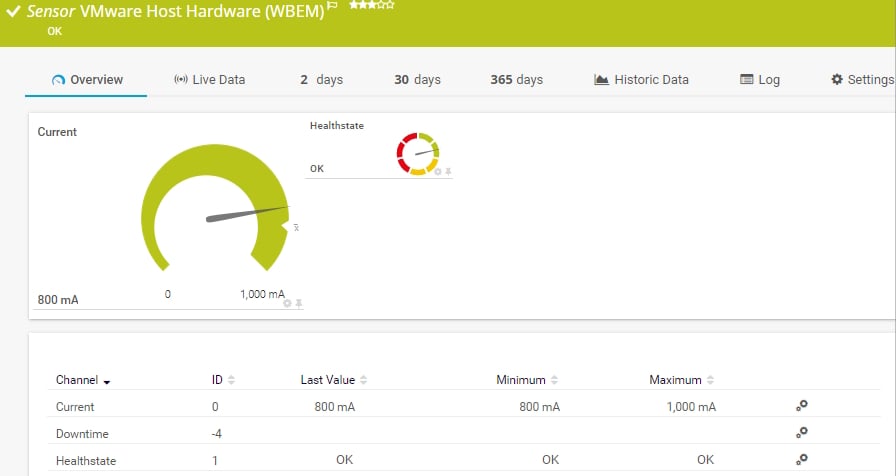
The VMware Host Hardware (WBEM) sensor monitors information about the hardware of an ESXi server using Web-based Enterprise Management (WBEM). It can show the following:
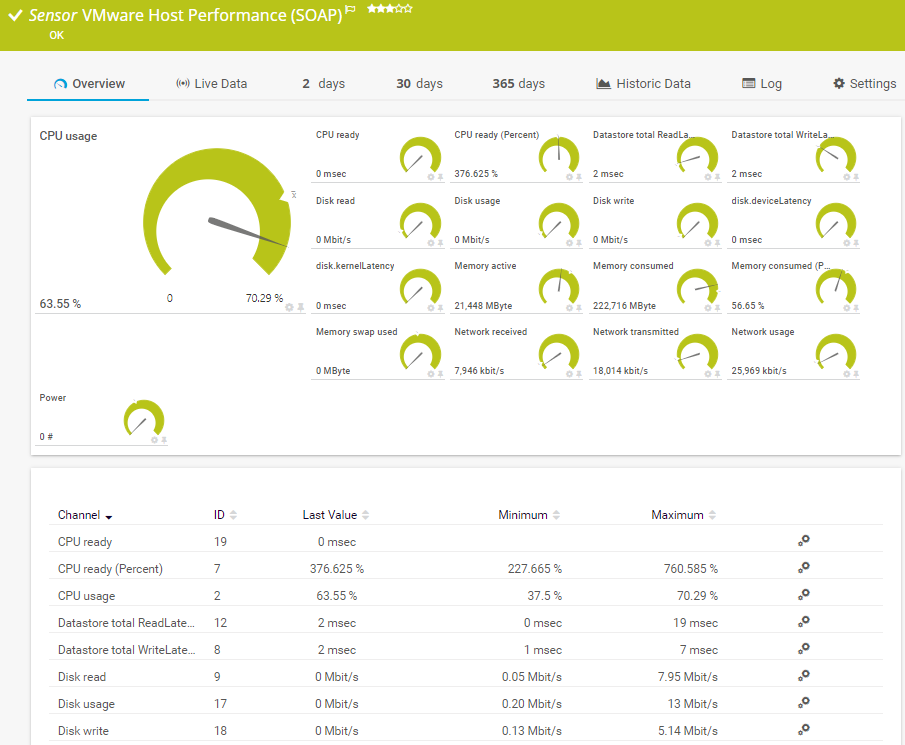
The VMware Host Performance (SOAP) sensor monitors a VMware host server using the Simple Object Access Protocol (SOAP). It can show the following and more:
The VMware Datastore (SOAP) sensor monitors the disk usage of a VMware datastore using the Simple Object Access Protocol (SOAP). It can show the following:
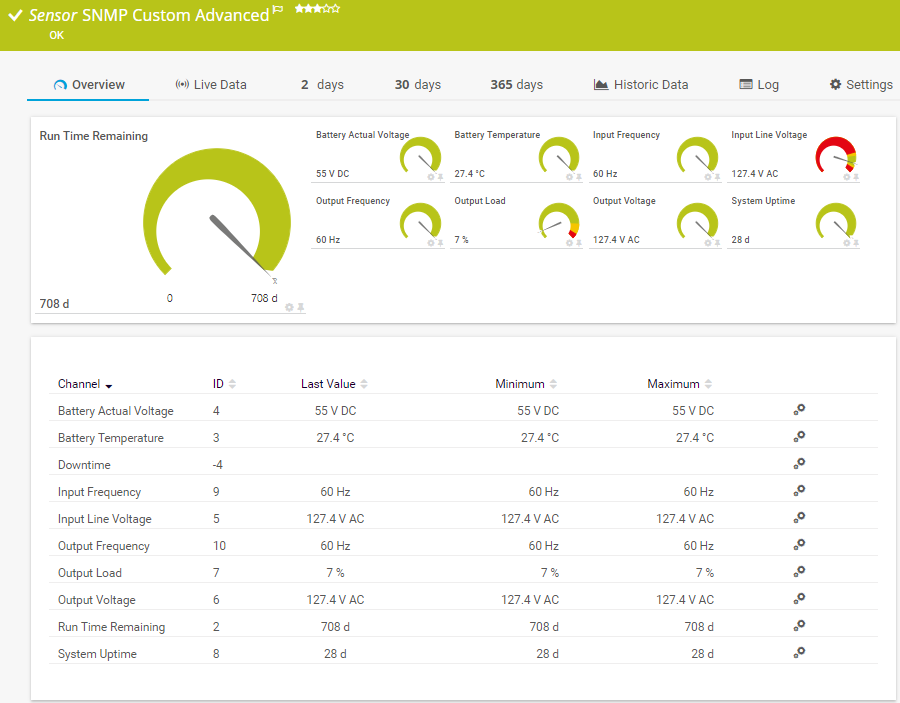
The SNMP Custom Advanced sensor monitors numeric values returned for object identifiers (OID). It can show the following:
See the PRTG Manual for a list of all available sensor types.

Custom alerts and data visualization let you quickly identify and prevent VMware performance issues.
PRTG is set up in a matter of minutes and can be used on a wide variety of mobile devices.


“Excellent tool for detailed monitoring. Alarms and notifications work greatly. Equipment addition is straight forward and server initial setup is very easy. ...feel safe to purchase it if you intend to monitor a large networking landscape.”
Partnering with innovative IT vendors, Paessler unleashes synergies to create
new and additional benefits for joined customers.
With the combination of PRTG and Insys, the monitoring specialist Paessler and the industrial gateway manufacturer INSYS icom offer a practical possibility to merge IT and OT.
Monitor all major physical hazards in IT rooms and racks such as critical climate factors, fire or burglary.
Paessler and Plixer provide a complete solution adding flow and metadata analysis to a powerful network monitoring tool.
Real-time notifications mean faster troubleshooting so that you can act before more serious issues occur.
Network Monitoring Software – Version 25.3.110.1313 (August 27, 2025)
Download for Windows and cloud-based version PRTG Hosted Monitor available
English, German, Spanish, French, Portuguese, Dutch, Russian, Japanese, and Simplified Chinese
Network devices, bandwidth, servers, applications, virtual environments, remote systems, IoT, and more
Choose the PRTG Network Monitor subscription that's best for you
VMware performance monitoring is the process of tracking and analyzing key metrics from your VMware vSphere environment, including ESXi hosts, vCenter Server, and virtual machines. It's about collecting the right data at the right time to ensure your virtual infrastructure runs optimally – like having a health monitoring system for your virtual environment.
Monitoring VMware performance is essential for:
In short, it's the difference between proactive management and reactive firefighting.
PRTG connects to your VMware environment using VMware's APIs, primarily through SOAP and WBEM protocols. It collects performance metrics from vCenter Server, ESXi hosts, and individual virtual machines, providing comprehensive visibility into your entire virtual infrastructure.
PRTG uses specialized sensors designed specifically for VMware monitoring, which automatically collect the most relevant performance metrics without requiring you to be a VMware expert. It's monitoring made simple, but powerful.
While there are hundreds of possible metrics in your virtual environment, these are the ones that truly matter:
PRTG collects these key metrics (and many more), giving you complete visibility into your VMware environment's performance without drowning you in unnecessary data.
In PRTG, “sensors” are the basic monitoring elements. One sensor usually monitors one measured value in your network, for example the traffic of a switch port, the CPU load of a server, or the free space on a disk drive. On average, you need about 5-10 sensors per device or one sensor per switch port.
Paessler conducted trials in over 600 IT departments worldwide to tune its network monitoring software closer to the needs of sysadmins. The result of the survey: over 95% of the participants would recommend PRTG – or already have.

Paessler PRTG is used by companies of all sizes. Sysadmins love PRTG because it makes their job a whole lot easier.
Bandwidth, servers, virtual environments, websites, VoIP services – PRTG keeps an eye on your entire network.
Everyone has different monitoring needs. That’s why we let you try PRTG for free.