Custom alerts and data visualization let you quickly identify and prevent virtual desktop performance issues .
Do you know what's happening in your virtual desktop environment right now? With PRTG comprehensive monitoring solution, you gain complete visibility into your VDI infrastructure, allowing you to detect and resolve issues before they affect productivity. Your users will experience consistently responsive virtual desktops.
Monitor every component of your VDI stack from a single interface. You can track physical hosts, virtual machines, storage systems, and network performance together. This holistic view helps you understand the relationships between different parts of your virtual server monitoring environment.
Pinpoint the exact source of performance problems in seconds, not hours. You can correlate metrics across different layers of your infrastructure to identify root causes. This rapid diagnosis capability minimizes downtime and keeps your remote desktop monitoring and business process monitoring at peak efficiency.
Transform complex VDI metrics, such as those from Omnissa Horizon, into easy-to-understand graphs and charts. You can create visual representations that clearly communicate system health to technical and non-technical stakeholders. These visualizations make performance trends in your CPU monitoring and virtualization monitoring environment immediately apparent.
Define performance parameters that match your specific business requirements. You can set different alert levels for various user groups, applications, and times of day. These tailored thresholds ensure you receive relevant notifications for your application performance monitoring and anomaly detection monitoring needs.
Diagnose network issues by continuously tracking virtual desktop performance, user session metrics and host resource utilization. Show latency measurements and other key metrics in real time. Visualize monitoring data in clear graphs and dashboards to identify problems more easily. Gain the overview you need to troubleshoot performance degradation and capacity limitations.

Device tree view of the complete monitoring setup

Custom PRTG dashboard for keeping an eye on the entire IT infrastructure

Live traffic data graph in PRTG
“All-around winning
network monitor”
“The real beauty of PRTG is the endless possibilities it offers”
“PRTG Network Monitor
is very hard to beat”
When managing virtual desktop infrastructure, you know how quickly things can go wrong. From sudden VM crashes to storage bottlenecks and hypervisor issues, problems in your VDI environment can leave users frustrated and unproductive. Even worse, troubleshooting these issues can feel like searching for a needle in a haystack without the right monitoring solution in place.
Choose the subscription model that perfectly fits your monitoring needs without breaking your budget. You can start small and scale up as your VDI environment grows, paying only for the sensors you actually need. Adjust your license at any time to accommodate changes in your virtualization monitoring and server performance monitoring requirements.
Access expert assistance whenever you encounter challenges with your monitoring setup. You can reach our knowledgeable support team through multiple channels including email, phone, and the comprehensive knowledge base. Benefit from fast response times and thorough solutions to keep your virtual machine monitoring and remote desktop monitoring running smoothly.
Consolidate alerts from your entire VDI stack into a single, manageable notification system. You can define escalation procedures, on-call schedules, and notification methods that match your operational workflow. Eliminate alert fatigue while ensuring critical issues in your Citrix monitoring and application performance monitoring environment never go unnoticed.
Deploy a monitoring solution that consumes very little resources on your VDI hosts. You can monitor your entire virtual desktop infrastructure without adding significant load to already busy servers. Maintain peak performance of your VMware monitoring and VMware ESXi monitoring environment even while comprehensive monitoring is active.
PRTG comes with more than 250 native sensor types for monitoring your entire on-premises, cloud, and hybrid cloud environment out of the box. Check out some examples below!
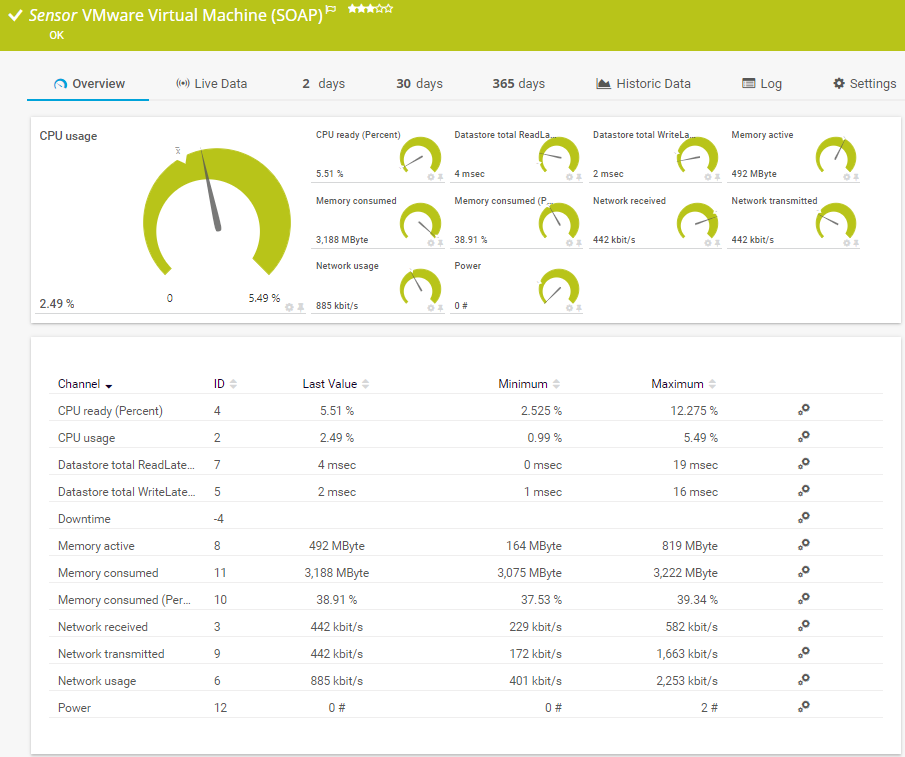
The VMware Virtual Machine (SOAP) sensor monitors a virtual machine (VM) on a VMware host server using the Simple Object Access Protocol (SOAP). It can show the following and more:
CPU readiness and usage
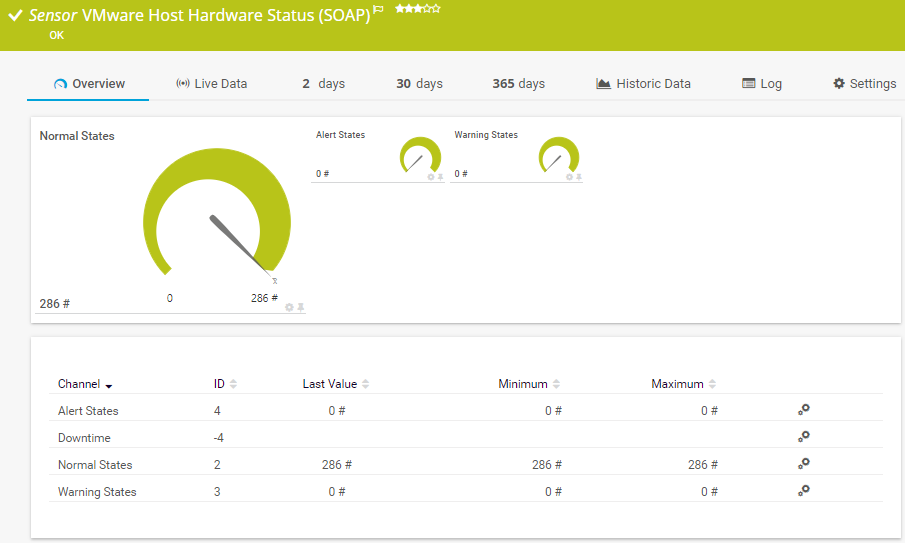
The VMware Host Hardware Status (SOAP) sensor monitors the hardware status of a VMware host server using the Simple Object Access Protocol (SOAP). It gives you a general status overview of the host. It can show the following:
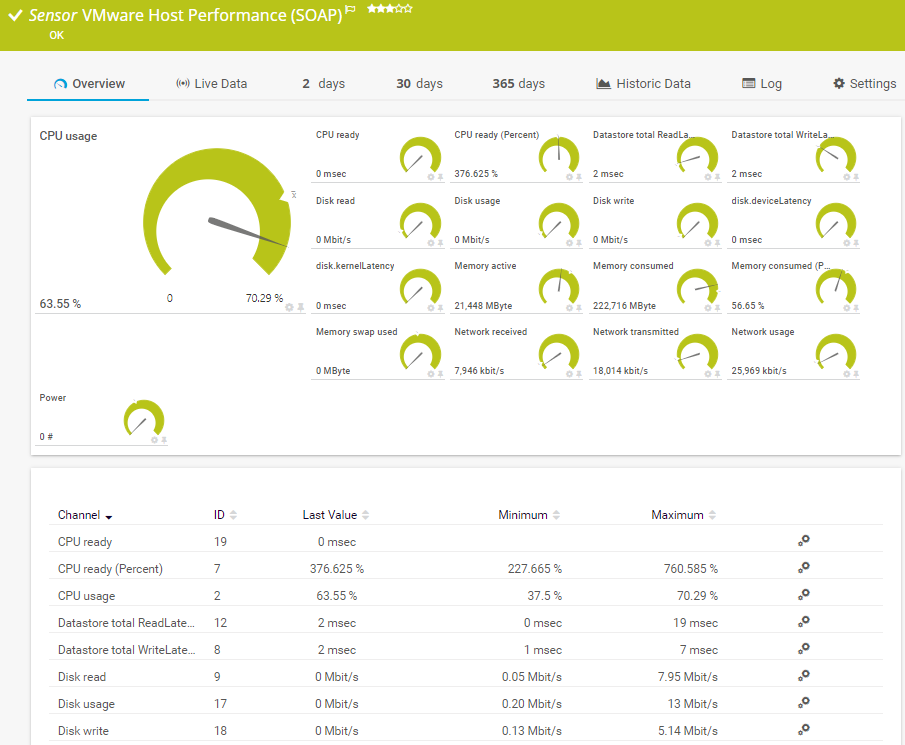
The VMware Host Performance (SOAP) sensor monitors a VMware host server using the Simple Object Access Protocol (SOAP). It can show the following and more:
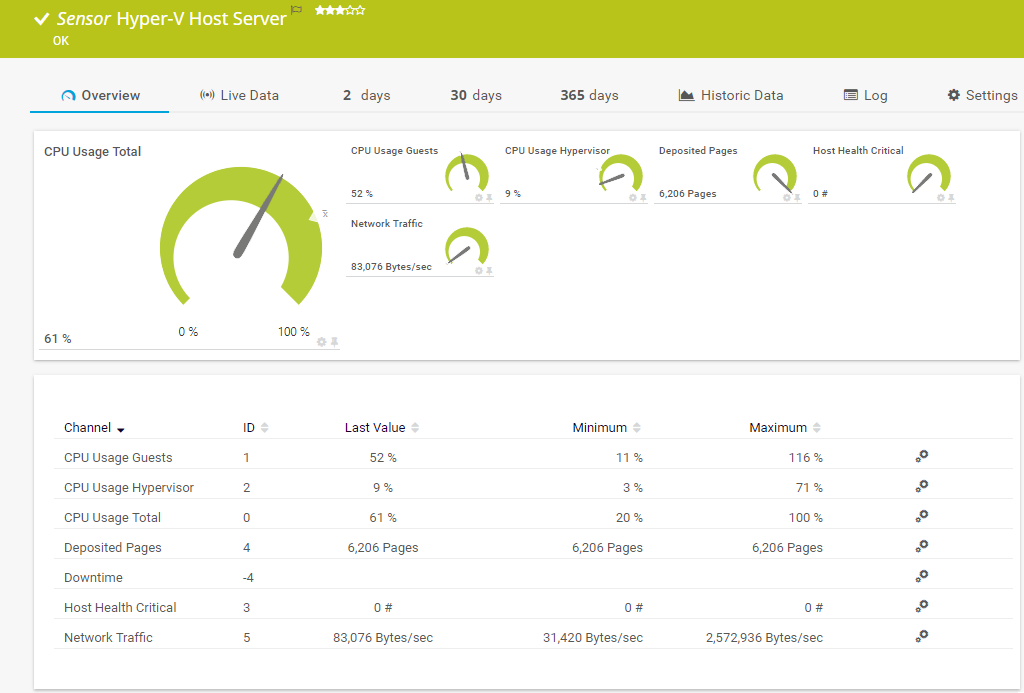
The Hyper-V Host Server sensor monitors a Microsoft Hyper-V host server via WMI or Windows performance counters. It can show the following:
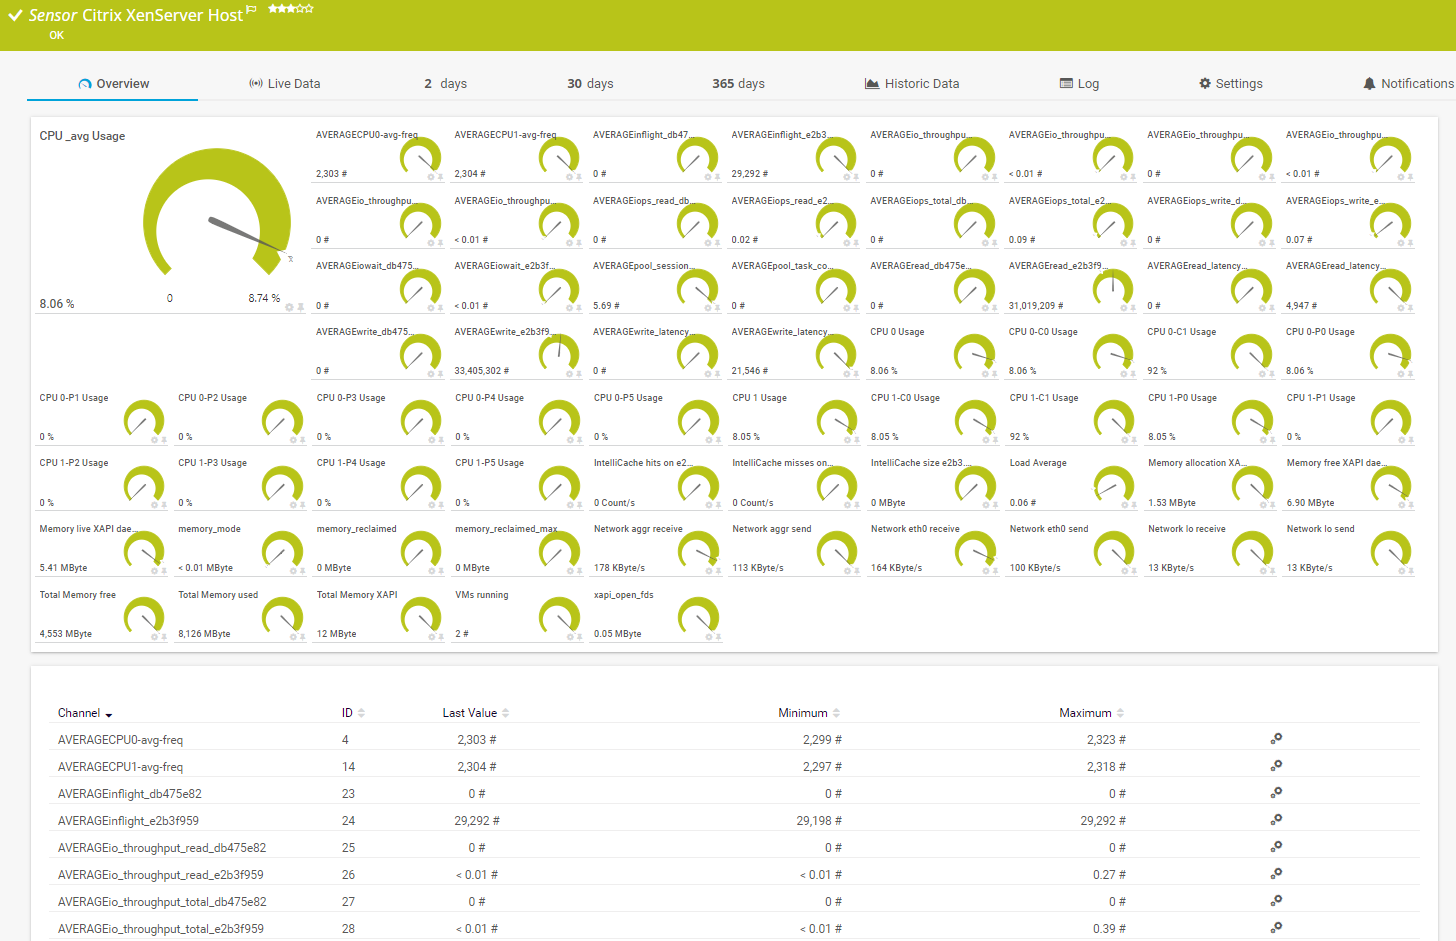
The Citrix XenServer Host sensor monitors a Xen host server via HTTP. It can show the following:
See the PRTG Manual for a list of all available sensor types.

Custom alerts and data visualization let you quickly identify and prevent latency and capacity issues.
PRTG is set up in a matter of minutes and can be used on a wide variety of mobile devices.

Partnering with innovative IT vendors, Paessler unleashes synergies to create
new and additional benefits for joined customers.
Monitor all major physical hazards in IT rooms and racks such as critical climate factors, fire or burglary.
Osirium’s experienced management team has an outstanding track record in cybersecurity and automation, establishing its headquarters near Reading, UK.
With ScriptRunner Paessler integrates a powerful event automation platform into PRTG Network Monitor.
Real-time notifications mean faster troubleshooting so that you can act before more serious issues occur.
Network Monitoring Software – Version 25.3.110.1313 (August 27, 2025)
Download for Windows and cloud-based version PRTG Hosted Monitor available
English, German, Spanish, French, Portuguese, Dutch, Russian, Japanese, and Simplified Chinese
Network devices, bandwidth, servers, applications, virtual environments, remote systems, IoT, and more
Choose the PRTG Network Monitor subscription that's best for you
A VDI monitoring tool provides end-to-end visibility into your virtual desktop infrastructure. It helps IT teams track performance metrics across virtual desktops, host servers, and endpoints to ensure optimal user experience. These tools collect data on CPU usage monitoring, memory monitoring, network latency monitoring, and other critical metrics to help identify and resolve performance issues before they impact productivity. With comprehensive VDI monitoring tools, you can establish performance baselines and observe when metrics deviate from normal patterns.
PRTG offers complete virtualization monitoring for your VDI environment. It provides real-time dashboards that display key performance indicators for Citrix monitoring, VMware monitoring, and Microsoft environments. PRTG automates the discovery of VDI components and continuously monitors metrics like logon times, application performance monitoring, and resource utilization. This comprehensive approach gives you visibility into your entire VDI infrastructure, from the data center to the end-user workspace.
For effective VDI monitoring, focus on these key metrics: CPU monitoring and memory usage on host servers, storage monitoring, network throughput, user logon times, application response times, and session duration. PRTG can track all these metrics with its server performance monitoring capabilities. Additionally, monitor endpoint monitoring to understand the digital experience from the user perspective. Establishing performance baselines for these metrics helps identify abnormal patterns that might indicate issues requiring network troubleshooting.
Yes, PRTG effectively monitors cloud-based VDI solutions including Microsoft Azure Virtual Desktop and AWS WorkSpaces. It provides insights into DaaS (Desktop as a Service) environments through cloud performance monitoring sensors. PRTG can track resource utilization, costs, and performance metrics for these cloud platforms, giving you complete observability across hybrid environments that combine on-premises and cloud monitoring for virtual desktops.
VDI monitoring directly impacts employee experience by ensuring virtual desktops perform optimally. By using application monitoring to track response times and identify bandwidth bottlenecks, IT teams can proactively address issues before users report them. This leads to faster, more responsive virtual desktops and improved productivity. PRTG helps identify the root cause of performance issues, whether they stem from network latency, insufficient resources, or application problems, allowing for quick resolution and a better overall digital experience.
Common use cases include: troubleshooting performance issues across the VDI stack, capacity planning based on usage patterns, optimizing resource allocation, tracking user experience metrics for SaaS applications accessed through virtual desktops, and ensuring compliance with service level agreements. PRTG supports all these scenarios through its comprehensive network monitoring capabilities. VDI monitoring tools are particularly valuable during migration projects, peak usage periods, and when implementing new VDI solutions.
PRTG provides unified monitoring that integrates VDI performance management with broader infrastructure monitoring. This holistic approach allows IT teams to correlate issues between virtual machine monitoring and underlying infrastructure components. For example, you can determine if slow virtual desktop performance stems from network congestion, storage bottlenecks, or host server problems. PRTG centralizes alerts & notifications and reporting across your entire environment, streamlining troubleshooting workflows and enabling more effective performance management for your complete IT infrastructure.
In PRTG, “sensors” are the basic monitoring elements. One sensor usually monitors one measured value in your network, for example the traffic of a switch port, the CPU load of a server, or the free space on a disk drive. On average, you need about 5-10 sensors per device or one sensor per switch port.
Paessler conducted trials in over 600 IT departments worldwide to tune its network monitoring software closer to the needs of sysadmins. The result of the survey: over 95% of the participants would recommend PRTG – or already have.

Paessler PRTG is used by companies of all sizes. Sysadmins love PRTG because it makes their job a whole lot easier.
Bandwidth, servers, virtual environments, websites, VoIP services – PRTG keeps an eye on your entire network.
Everyone has different monitoring needs. That’s why we let you try PRTG for free.