Custom alerts and data visualization let you quickly identify and prevent virtualization bottlenecks issues.
Are you struggling to keep track of your virtual environment health and performance? With PRTG Hyper-V monitoring capabilities, you can transform complex virtualization data into actionable insights that help prevent downtime and optimize resource allocation.
PRTG provides you with a comprehensive view of your entire Hyper-V infrastructure from hosts to virtual machines. You can monitor CPU usage, memory allocation, and disk performance through a single pane of glass. This unified approach eliminates the need to switch between multiple monitoring tools.
Create personalized dashboards that display exactly the metrics that matter most to your virtualization strategy. You can arrange widgets to show real-time performance data, historical trends, and health status indicators. These visual representations make complex data instantly understandable at a glance.
Set up intelligent notification systems that alert you before small issues become major problems in your virtual environment. You can define custom thresholds based on your specific requirements and business priorities. These timely alerts help you address performance bottlenecks before they impact end users.
Generate comprehensive reports that document the performance and availability of your Hyper-V infrastructure over time. You can schedule automated reports to be delivered to stakeholders on a regular basis. These insights support capacity planning and help justify infrastructure investments.
Diagnose network issues by continuously tracking hypervisor health, virtual machine status, and network traffic. Show CPU load, memory consumption, disk I/O, and other key metrics in real time. Visualize monitoring data in clear graphs and dashboards to identify problems more easily. Gain the overview you need to troubleshoot system failures and resource constraints.

Device tree view of the complete monitoring setup

Custom PRTG dashboard for keeping an eye on the entire IT infrastructure

Live traffic data graph in PRTG
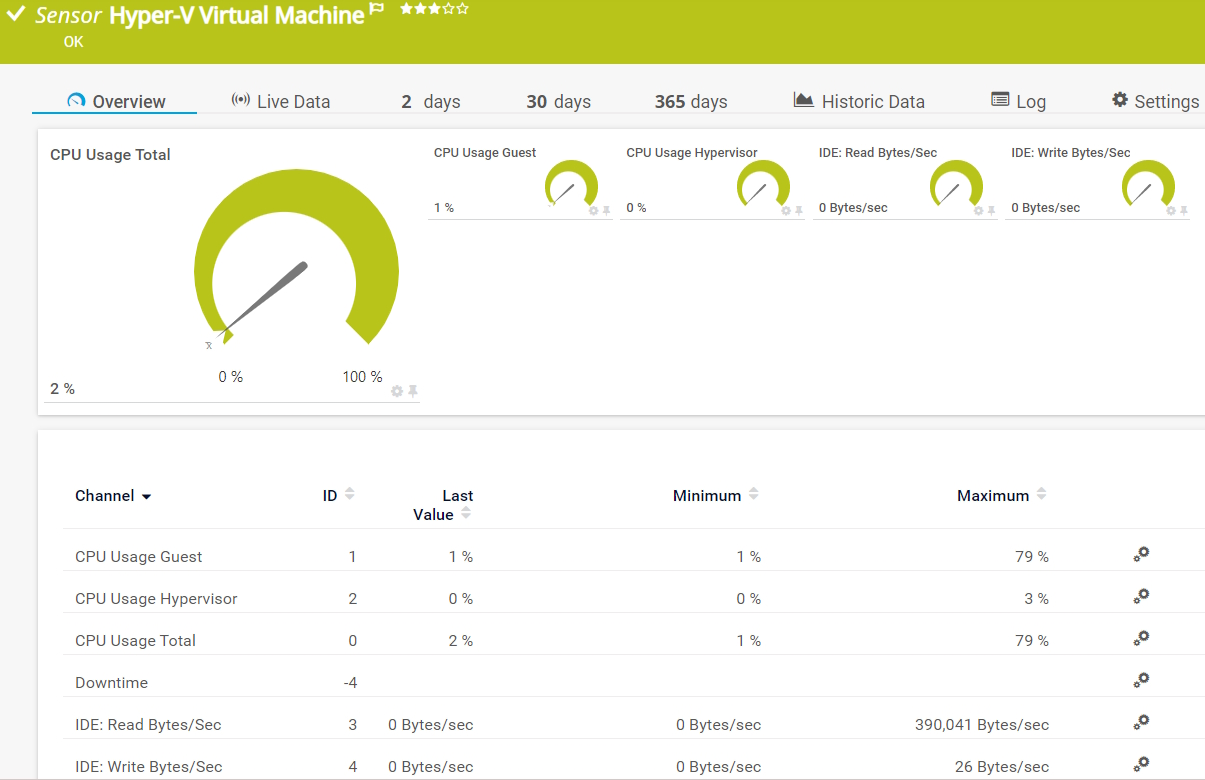
Hyper-V VM Monitoring – CPU and Disk Activity Insights via PRTG.
“All-around winning
network monitor”
“The real beauty of PRTG is the endless possibilities it offers”
“PRTG Network Monitor
is very hard to beat”
Running a virtualized environment without proper monitoring is like driving blindfolded. When your Hyper-V infrastructure experiences issues, virtual machines can suddenly crash, applications become unresponsive, and users start flooding your inbox with complaints. Without visibility into what's happening behind the scenes, you're left guessing at the root cause while productivity grinds to a halt.
Choose the subscription model that perfectly fits your infrastructure size without hidden costs or complicated pricing tiers. Scale up or down as your virtualization needs evolve, paying only for the sensors you actually need. Avoid the budget surprises that come with many enterprise monitoring solutions that charge per VM or CPU socket.
Access expert assistance whenever you encounter challenges with your monitoring setup through multiple channels including phone, email, and knowledge base resources. Benefit from the experience of a dedicated support team that understands both monitoring requirements and virtualization technologies.
Extend your visibility beyond just Hyper-V to include the entire IT stack from physical hardware to applications running on your virtual machines. Correlate performance issues across different technology layers to identify complex problems that span multiple systems. Eliminate the need to juggle separate tools for different parts of your infrastructure.
Reduce manual work by setting up automatic responses to common virtualization issues like resource contention or VM sprawl. Create custom notifications that trigger specific actions when predefined conditions are met in your Hyper-V environment. Free up your time to focus on strategic projects instead of constantly firefighting virtualization problems.
PRTG comes with more than 250 native sensor types for monitoring your entire on-premises, cloud, and hybrid cloud environment out of the box. Check out some examples below!
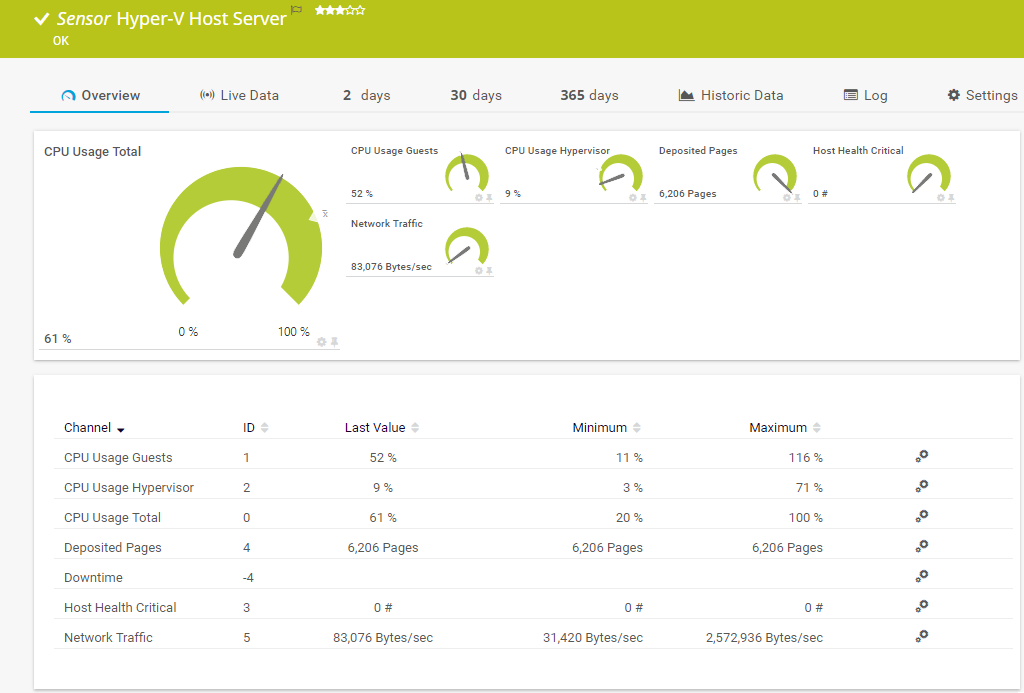
The Hyper-V Host Server sensor monitors a Microsoft Hyper-V host server via WMI or Windows performance counters. It can show the following:
The Hyper-V Virtual Machine sensor monitors a virtual machine that runs on a Microsoft Hyper-V host server via WMI or Windows performance counters. It can show the following:
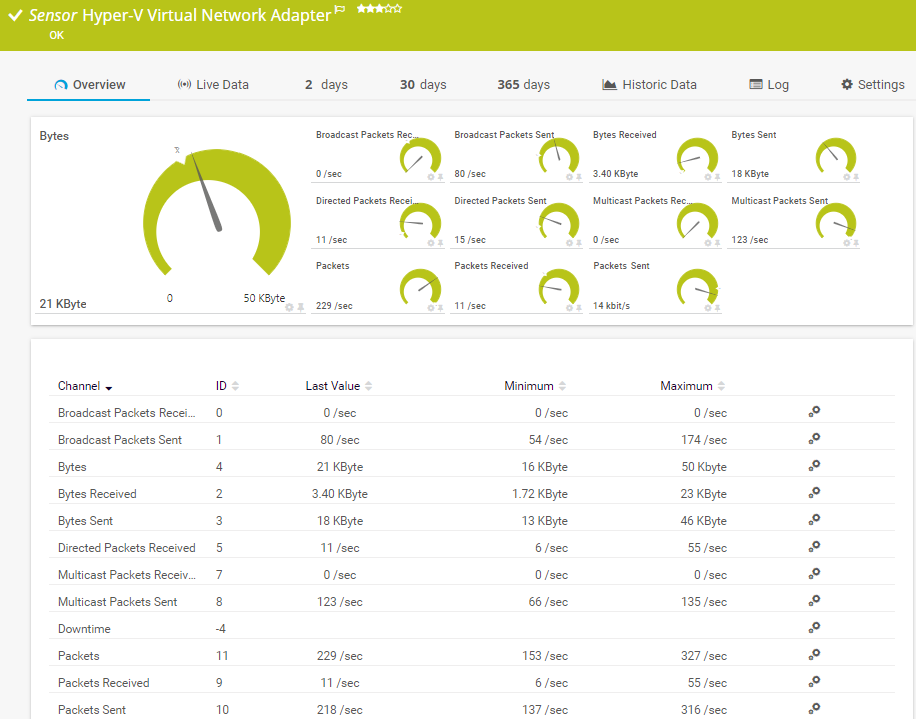
The Hyper-V Virtual Network Adapter sensor monitors virtual network adapters that run on a Microsoft Hyper-V host server via WMI or Windows performance counters. It can show the following:
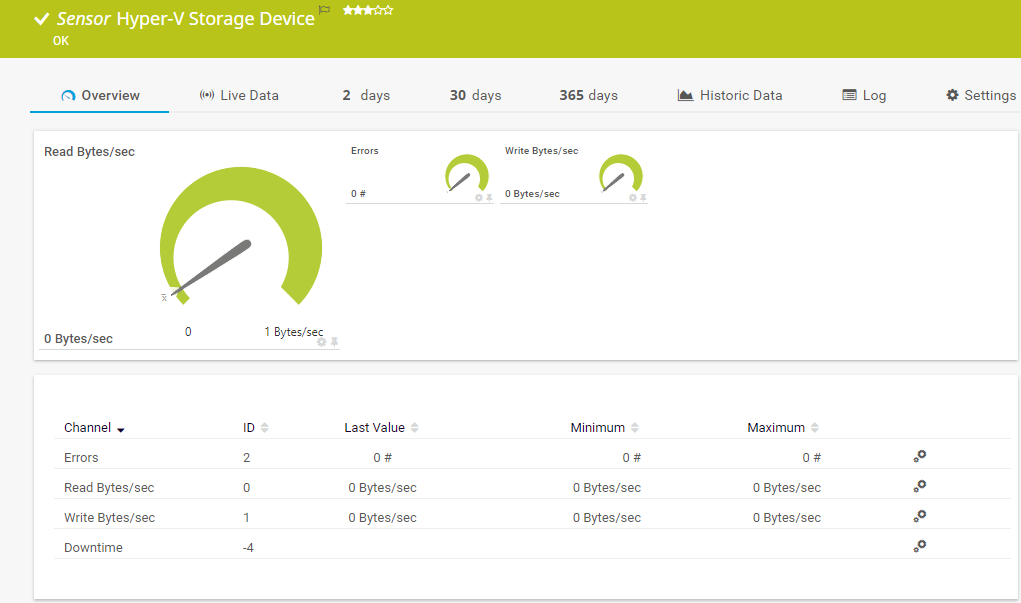
The Hyper-V Virtual Storage Device sensor monitors a virtual storage device that runs on a Microsoft Hyper-V host server via WMI or Windows performance counters. It can show the following:
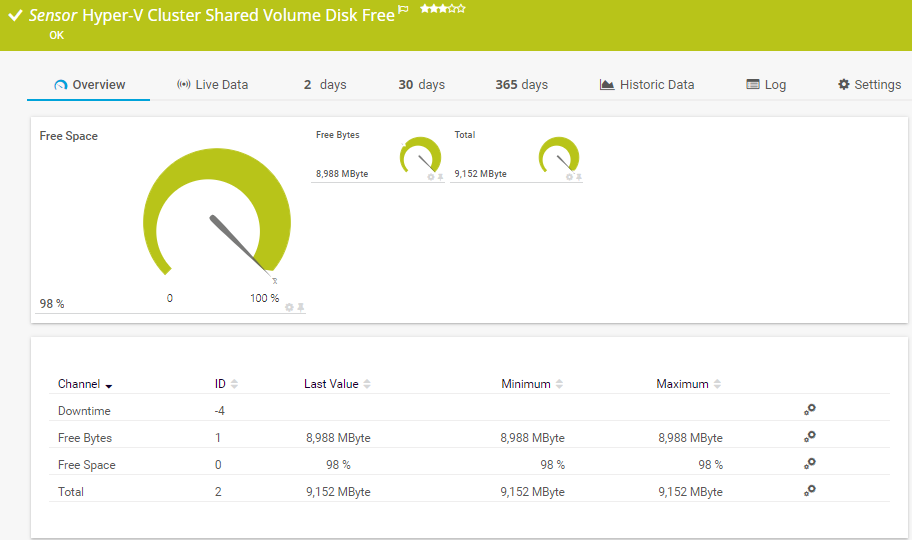
The Hyper-V Cluster Shared Volume Disk Free sensor monitors a Microsoft Hyper-V cluster shared volume via PowerShell. It can show the following:
See the PRTG Manual for a list of all available sensor types.

Custom alerts and data visualization let you quickly identify and prevent virtualization bottlenecks.
PRTG is set up in a matter of minutes and can be used on a wide variety of mobile devices.

Partnering with innovative IT vendors, Paessler unleashes synergies to create
new and additional benefits for joined customers.
Axis offers one of the most complete and reliable product portfolios, an expanded professional network, and comprehensive integration support for video management software.
Osirium’s experienced management team has an outstanding track record in cybersecurity and automation, establishing its headquarters near Reading, UK.
UVexplorer integrates tightly with PRTG to bring fast and accurate network discovery, detailed device inventory, and automatic network mapping to the PRTG platform.
Real-time notifications mean faster troubleshooting so that you can act before more serious issues occur.
Network Monitoring Software – Version 25.3.110.1313 (August 27, 2025)
Download for Windows and cloud-based version PRTG Hosted Monitor available
English, German, Spanish, French, Portuguese, Dutch, Russian, Japanese, and Simplified Chinese
Network devices, bandwidth, servers, applications, virtual environments, remote systems, IoT, and more
Choose the PRTG Network Monitor subscription that's best for you
Hyper-V performance monitoring refers to tracking and analyzing performance metrics of Microsoft Hyper-V virtual environments. This includes monitoring both the Hyper-V hypervisor and guest VMs to ensure optimal resource usage across your workloads. Effective Hyper-V monitoring tools track CPU usage, memory allocation, disk read operations, network interface traffic, and other critical performance counters that affect your virtual infrastructure.
While Windows Server includes basic tools like Task Manager and Resource Monitor for basic monitoring, PRTG offers comprehensive functionality beyond these native options. PRTG provides continuous monitoring of your entire Hyper-V infrastructure with preconfigured sensors that track both logical processor performance and available memory. Unlike Windows tools, PRTG automatically alerts you when issues arise and provides customizable dashboards that help identify the root cause of performance problems before they impact your workloads.
PRTG includes five specialized sensors: Hyper-V Host Server Sensor (monitors CPU usage and network traffic), Hyper-V Virtual Machine Sensor (tracks individual VM performance including virtual processor utilization), Hyper-V Virtual Network Adapter Sensor, Hyper-V Virtual Storage Device Sensor, and Hyper-V Cluster Shared Volume Disk Free Sensor. These work together to provide complete visibility into your Hyper-V environment without complex configuration.
Yes, PRTG excels at monitoring heterogeneous virtual infrastructures that include both Microsoft Hyper-V and VMware hypervisors. PRTG offers dedicated sensors for each platform, allowing you to monitor performance metrics and resource usage across your entire virtual infrastructure from a single dashboard, regardless of which providers you use for virtualization.
Absolutely. PRTG effectively monitors Hyper-V environments regardless of the operating systems running on guest VMs. For Linux VMs, PRTG tracks resource allocation and performance from the hypervisor level without requiring agents inside the Linux operating system. For more detailed monitoring, PRTG offers additional sensors that can monitor Linux-specific metrics via SSH or SNMP.
PRTG integrates seamlessly with complex environments that incorporate Azure or System Center. For Hyper-V management in hybrid deployments, PRTG monitors both on-premises Hyper-V servers and cloud resources. PRTG can execute PowerShell scripts to automate management tasks or gather additional performance metrics not available through standard monitoring channels, making it ideal for sophisticated Hyper-V deployments with diverse workloads.
In PRTG, “sensors” are the basic monitoring elements. One sensor usually monitors one measured value in your network, for example the traffic of a switch port, the CPU load of a server, or the free space on a disk drive. On average, you need about 5-10 sensors per device or one sensor per switch port.
Paessler conducted trials in over 600 IT departments worldwide to tune its network monitoring software closer to the needs of sysadmins. The result of the survey: over 95% of the participants would recommend PRTG – or already have.

Paessler PRTG is used by companies of all sizes. Sysadmins love PRTG because it makes their job a whole lot easier.
Bandwidth, servers, virtual environments, websites, VoIP services – PRTG keeps an eye on your entire network.
Everyone has different monitoring needs. That’s why we let you try PRTG for free.