Custom alerts and data visualization let you quickly identify and prevent server resource bottlenecks.
Unexpected server crashes during peak business hours. Critical applications slowing to a crawl. Frustrated users flooding your helpdesk with tickets. Sound familiar? When server capacity issues strike, they hit where it hurts most—your productivity and your reputation.
Paessler PRTG cuts through these challenges by giving you real-time visibility into server resources before they become critical. Identify CPU bottlenecks, memory leaks, and disk I/O constraints before they impact operations. Stop reacting to emergencies and start preventing them with capacity monitoring that works as hard as you do.

PRTG delivers complete visibility into your server resources, server load monitoring, helping you maintain optimal performance while planning for future needs. Our unified monitoring approach simplifies capacity management across on-premises, virtual, and cloud environments.
Server bottlenecks can impact application performance and user experience. PRTG keeps watch of your CPU usage, memory allocation, and disk I/O in real-time, allowing you to identify potential issues early. Custom thresholds alert you when resources approach critical levels, enabling proactive resolution before users are affected.
Effective capacity planning requires comprehensive historical performance data to identify trends. PRTG automatically collects and stores detailed performance metrics, allowing you to analyze resource utilization patterns over time. With customizable graphs, you can easily visualize server performance trends and make data-driven decisions about hardware upgrades and workload distribution.
When server performance issues occur, quickly identifying the root cause is essential. PRTG provides end-to-end visibility into your server environment with root cause analysis, including dependencies between systems. The correlation between different metrics helps pinpoint whether issues stem from CPU constraints, memory limitations, or disk bottlenecks.
Diagnose network issues by continuously tracking resource utilization across your entire infrastructure. Show CPU usage, memory allocation, disk I/O, and other key metrics in real time. Visualize monitoring data in clear graphs and dashboards to identify problems more easily. Gain the overview you need to troubleshoot server bottlenecks and prevent capacity issues before they impact users.

Device tree view of the complete monitoring setup

Custom PRTG dashboard for keeping an eye on the entire IT infrastructure

Live traffic data graph in PRTG
“All-around winning
network monitor”
“The real beauty of PRTG is the endless possibilities it offers”
“PRTG Network Monitor
is very hard to beat”
PRTG transforms complex server capacity data into actionable insights, helping IT teams maintain peak performance while optimizing resource allocation across virtualized, cloud-based, and on-premises infrastructure.
PRTG provides extensive coverage of server capacity metrics through diverse sensor types. Monitor CPU utilization to identify processing bottlenecks, memory usage to prevent paging issues, and disk space to avoid storage limitations. Track disk I/O performance and bandwidth usage to identify network constraints.
Effective capacity monitoring requires knowing when resource utilization approaches critical levels. PRTG allows you to set custom proactive thresholds for all monitored metrics, with multiple levels for escalating notifications. Configure warning thresholds for early notification and error thresholds for situations requiring immediate attention via email, push notifications, or ticketing systems.
Different team members need different views of server capacity data. PRTG's customizable dashboards allow you to create specific views for various stakeholders. Technical staff can access detailed metrics, while management can view high-level capacity trends and SLA compliance reports with live status information.
PRTG comes with more than 250 native sensor types for monitoring your entire on-premises, cloud, and hybrid cloud environment out of the box. Check out some examples below!
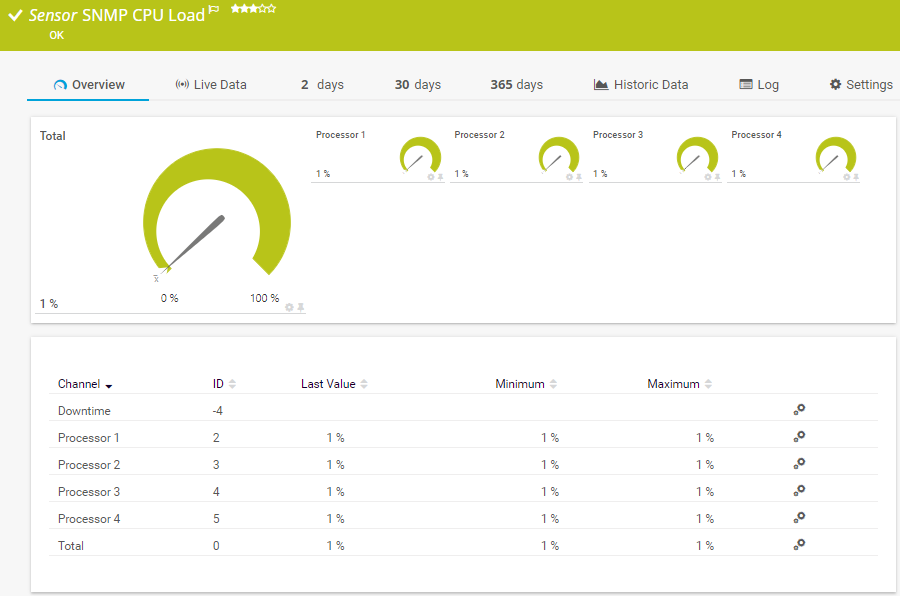
The SNMP CPU Load sensor monitors the system load. It can show the following:
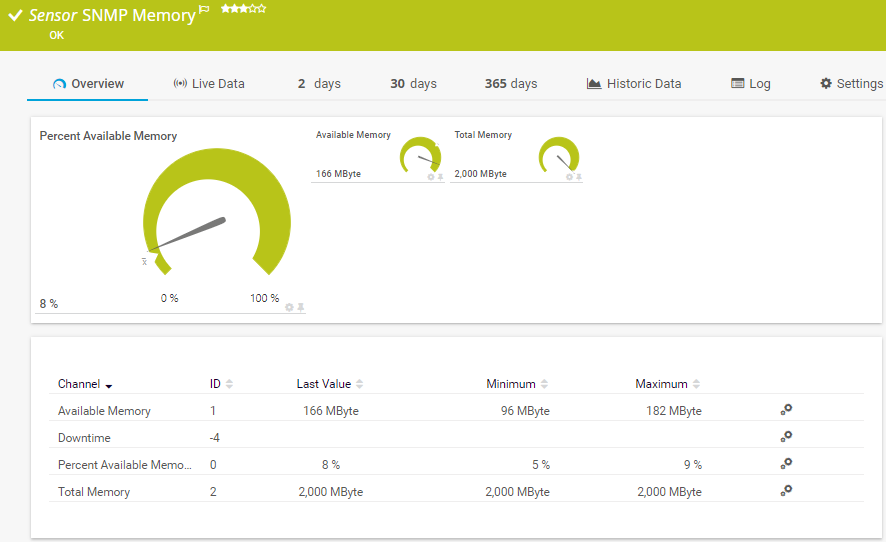
The SNMP Memory sensor monitors the memory usage of a system. It can show the following:
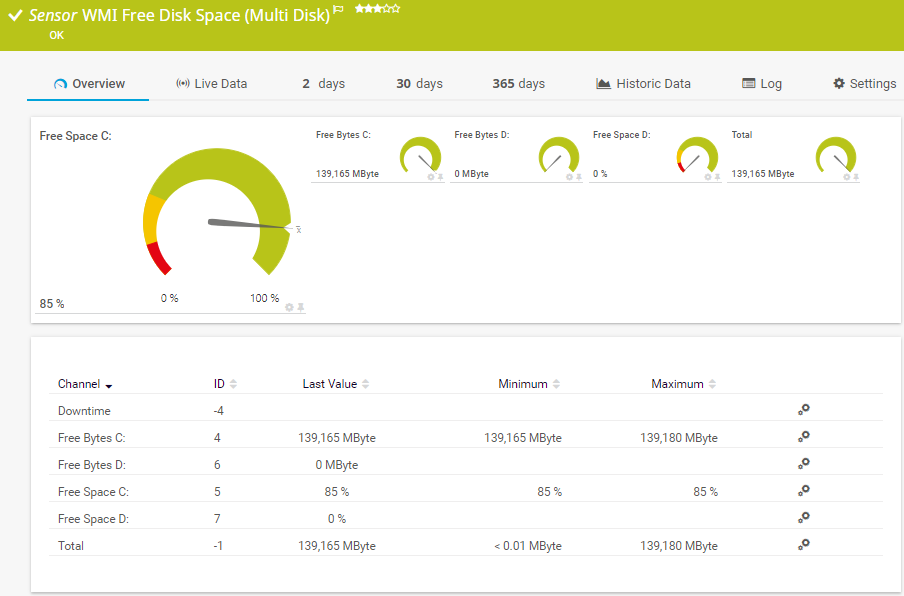
The WMI Free Disk Space (Multi Disk) sensor monitors the free disk space of one or more drives. It can show the following:
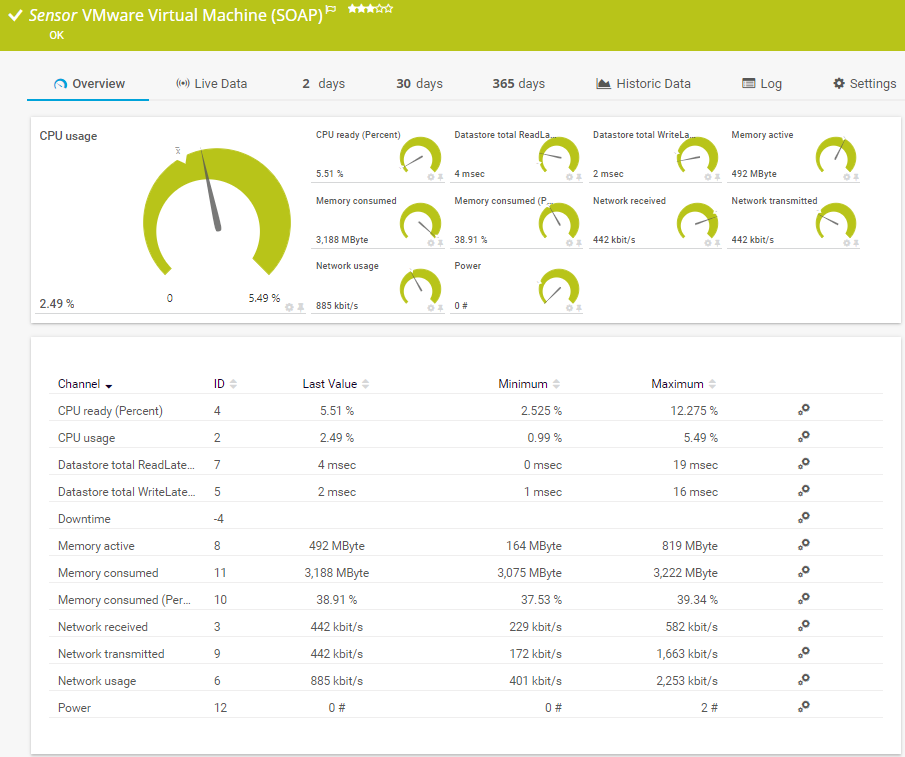
The VMware Virtual Machine (SOAP) sensor monitors a virtual machine (VM) on a VMware host server using the Simple Object Access Protocol (SOAP). It can show the following and more:
CPU readiness and usage
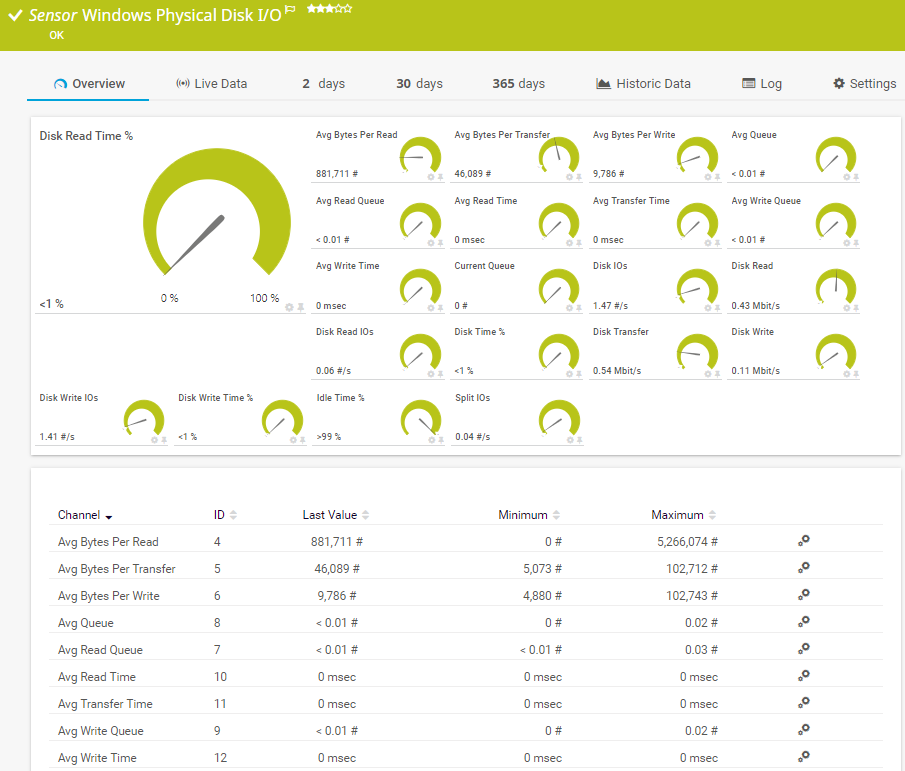
The Windows Physical Disk I/O sensor monitors the input/output (I/O) parameters of a hard disk on a Windows system via Windows Management Instrumentation (WMI) or Windows performance counters. It can show the following:
See the PRTG Manual for a list of all available sensor types.

Custom alerts and data visualization let you quickly identify and prevent performance and resource bottlenecks.
PRTG is set up in a matter of minutes and can be used on a wide variety of mobile devices.

Partnering with innovative IT vendors, Paessler unleashes synergies to create
new and additional benefits for joined customers.
Combining their tools to a powerful solution for advanced analysis and automation, KnowledgeRiver and Paessler enable IT teams to ensure best performance for their infrastructure and networks.
Integrating monitoring results from PRTG into NetBrain maps makes the foundation for network automation.
With ScriptRunner Paessler integrates a powerful event automation platform into PRTG Network Monitor.
Real-time notifications mean faster troubleshooting so that you can act before more serious issues occur.
Network Monitoring Software – Version 25.3.110.1313 (August 27, 2025)
Download for Windows and cloud-based version PRTG Hosted Monitor available
English, German, Spanish, French, Portuguese, Dutch, Russian, Japanese, and Simplified Chinese
Network devices, bandwidth, servers, applications, virtual environments, remote systems, IoT, and more
Choose the PRTG Network Monitor subscription that's best for you
Server capacity monitoring is the process of continuously tracking and analyzing server resource usage to ensure optimal performance and prevent bottlenecks. It involves monitoring key metrics like CPU utilization, memory allocation, disk space, and response time.
This monitoring system is crucial for maintaining server health, preventing outages, and ensuring high uptime. Effective capacity monitoring helps IT operations identify potential resource constraints before they cause disruptions, establish performance baselines, and maintain service level agreements (SLAs).
PRTG provides comprehensive server monitoring software with specialized tools for capacity monitoring across physical, virtual, and cloud environments. These tools monitor server performance metrics including CPU, memory, disk I/O, and latency.
PRTG's server monitoring tools support various operating systems including Microsoft Windows, Linux, and virtualization platforms. The software offers automated alerts, customizable dashboards, and detailed reports that help maintain optimal system performance while identifying potential server issues before they impact critical functions.
PRTG monitors virtual servers through specialized sensors designed for virtualization platforms like VMware and Hyper-V. For cloud environments, PRTG offers dedicated monitoring capabilities for major providers including AWS, Azure, and other cloud services.
The monitoring system tracks resource usage, application performance, and server health across hybrid infrastructures. PRTG's scalable architecture allows it to monitor everything from small deployments to large data centers, providing comprehensive observability across your entire IT infrastructure.
Yes, PRTG offers extensive monitoring for web servers and applications. The server monitoring software tracks key metrics like response time, error rates, and resource utilization for popular web server platforms. For application monitoring, PRTG provides sensors that monitor app availability, performance, and user experience.
This comprehensive approach helps identify bottlenecks, vulnerabilities, and performance issues before they impact end users, allowing IT teams to maintain optimal application delivery.
Automation is a core function of PRTG's server performance monitoring capabilities. The system automatically discovers network components, deploys appropriate sensors, and establishes baseline performance metrics. When thresholds are exceeded, PRTG automatically triggers notifications and can initiate predefined actions.
This automation reduces manual monitoring tasks, ensures consistent monitoring coverage, and makes faster response to potential server issues possible. By automating routine monitoring processes, IT teams can focus on strategic infrastructure improvements rather than reactive troubleshooting.
In PRTG, “sensors” are the basic monitoring elements. One sensor usually monitors one measured value in your network, for example the traffic of a switch port, the CPU load of a server, or the free space on a disk drive. On average, you need about 5-10 sensors per device or one sensor per switch port.
Paessler conducted trials in over 600 IT departments worldwide to tune its network monitoring software closer to the needs of sysadmins. The result of the survey: over 95% of the participants would recommend PRTG – or already have.

Paessler PRTG is used by companies of all sizes. Sysadmins love PRTG because it makes their job a whole lot easier.
Bandwidth, servers, virtual environments, websites, VoIP services – PRTG keeps an eye on your entire network.
Everyone has different monitoring needs. That’s why we let you try PRTG for free.