Custom alerts and data visualization let you quickly identify and prevent bandwidth bottlenecks and latency issues.
Are you having trouble maintaining visibility across your distributed SD-WAN infrastructure? Our PRTG SD-WAN monitoring solution provides complete insight into overlay and underlay networks, ensuring optimal performance and enabling you to quickly identify and resolve issues before they affect your users.
Monitor your entire SD-WAN environment from one central location. With PRTG, you can create customized dashboards that display critical metrics such as bandwidth utilization, latency, and packet loss across all locations. The dashboard becomes the central hub for monitoring SD-WAN health and performance.
Receive instant notifications when performance issues arise in your SD-WAN network. The flexible notification system from PRTG enables you to set custom thresholds for critical metrics like latency, jitter, and packet loss. This ensures you receive immediate information when network conditions deteriorate, allowing your team to address problems before users experience disruptions.
Deploy monitoring regardless of your SD-WAN provider or hardware. PRTG supports major SD-WAN vendors, including Cisco, Meraki, and Fortinet. This allows you to monitor heterogeneous environments without the need for additional tools or added complexity. Your investment remains protected as your network infrastructure evolves.
Generate detailed reports on SD-WAN performance and reliability. The reporting capabilities from PRTG enable you to document network performance over time, verify SLA compliance, and identify trends that might indicate future issues. Management teams receive clear insights into network operations and ROI.
Diagnose network issues by continuously tracking network paths, traffic patterns and device status. Show WAN link health, throughput, response times and other key metrics in real time. Visualize monitoring data in clear graphs and dashboards to identify problems more easily. Gain the overview you need to troubleshoot routing inefficiencies and connectivity failures.

Device tree view of the complete monitoring setup

Custom PRTG dashboard for keeping an eye on the entire IT infrastructure

Live traffic data graph in PRTG
“All-around winning
network monitor”
“The real beauty of PRTG is the endless possibilities it offers”
“PRTG Network Monitor
is very hard to beat”
Problems in SD-WAN environments can quickly become challenging. Without proper visibility, you could waste hours trying to determine whether issues stem from your overlay network, underlay infrastructure, or somewhere in between, all while users complain and critical applications suffer.
Select a subscription model that meets your exact monitoring needs so you don't pay for unused capacity. As your SD-WAN environment grows or changes, scale your monitoring solution up or down to ensure you always have the right level of visibility. Simplify budgeting for network monitoring with straightforward options that eliminate the headache of complicated licensing schemes.
Monitor your SD-WAN infrastructure for early warning signs to detect potential issues before they escalate into full-blown problems. Establish baseline performance metrics for normal operations and receive alerts when patterns deviate. This allows you to perform preventive maintenance before users notice any impact. Maintain optimal network health by continuously assessing critical SD-WAN components and connections.
Get the help you need when you run into problems with your monitoring setup or need to interpret complex SD-WAN metrics. Take advantage of comprehensive documentation, active user forums, and direct support from engineers who are familiar with both monitoring principles and SD-WAN technologies. Get expert guidance to accelerate your troubleshooting, resolve issues faster, and implement best practices for your specific environment.
Streamline repetitive monitoring tasks with powerful automation features that reduce manual effort and human error. Create scripts that automatically respond to specific SD-WAN conditions. For example, they can fail over to backup connections or adjust quality of service parameters when congestion is detected. Integrate PRTG with your existing IT management workflow tools to create a cohesive ecosystem that improves operational efficiency throughout your network infrastructure.
PRTG comes with more than 250 native sensor types for monitoring your entire on-premises, cloud, and hybrid cloud environment out of the box. Check out some examples below!
The SNMP Traffic v2 sensor monitors bandwidth and traffic on a device. It can show the following:
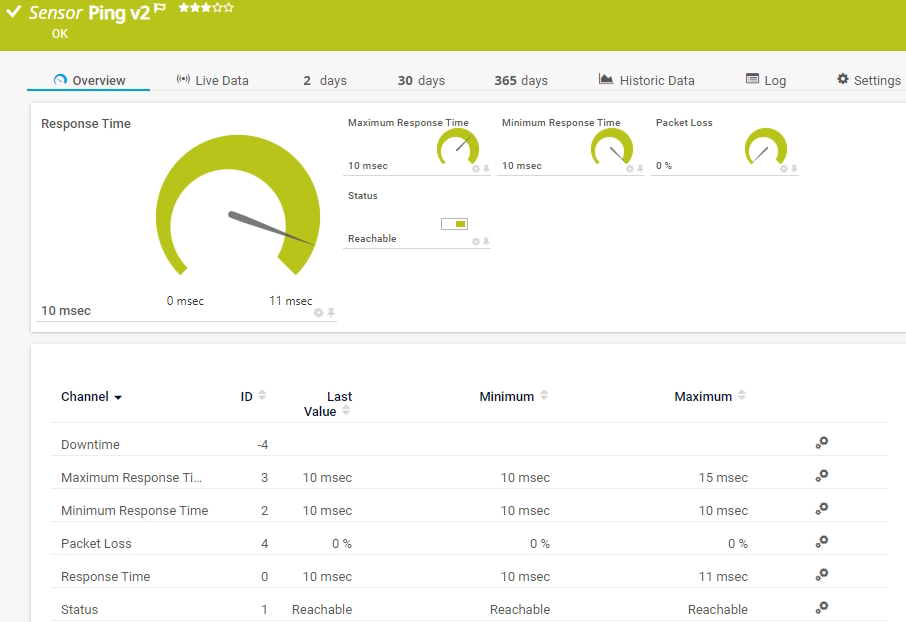
The Ping v2 sensor sends an Internet Control Message Protocol (ICMP) echo request ("ping") from the probe system to the parent device to monitor its availability. It can show the following:
• Response time
• Packet loss
• Target status
• Minimum and maximum ping time
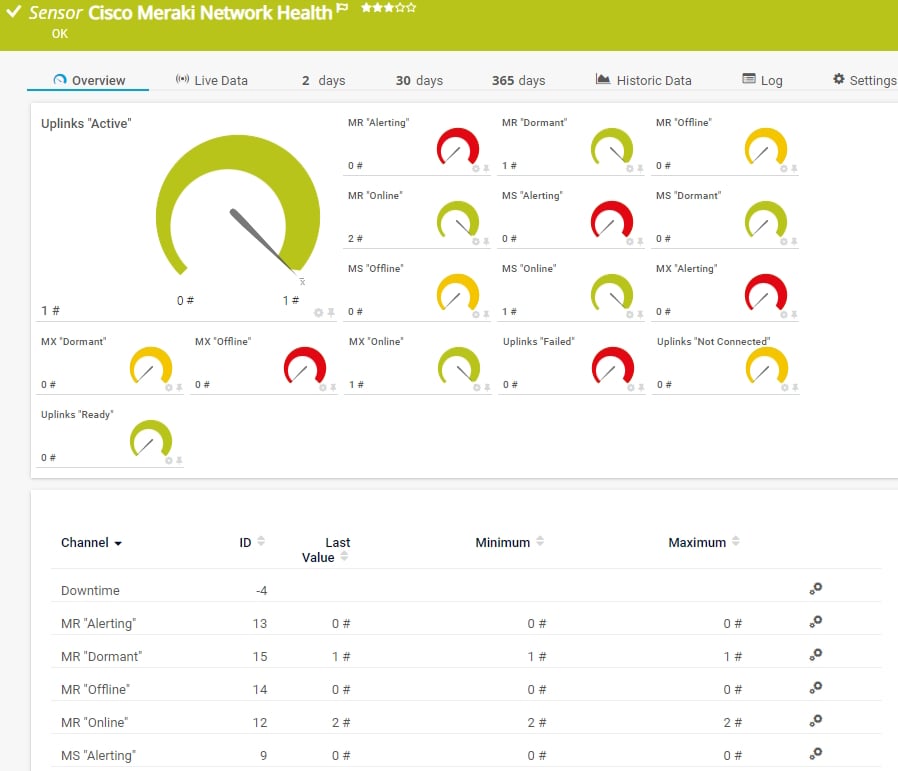
The Cisco Meraki Network Health sensor monitors the health of Cisco Meraki network devices via the Cisco Meraki Dashboard API. It can show the following:
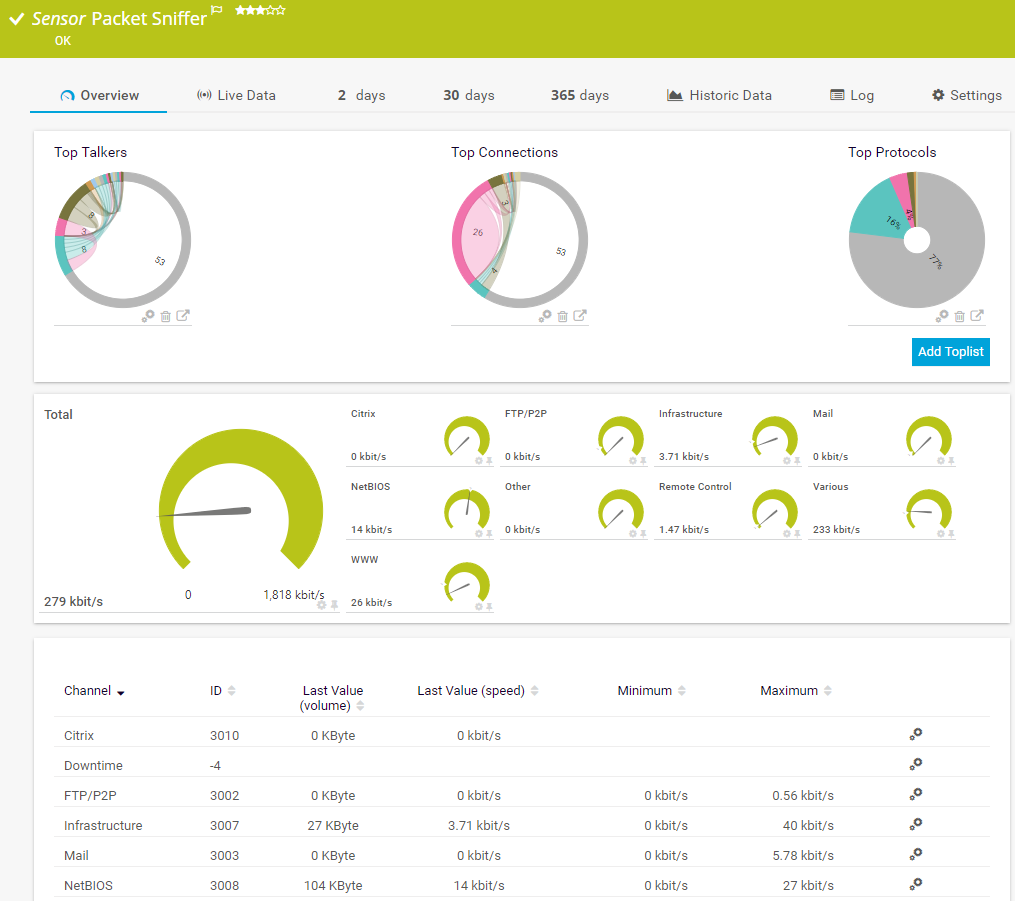
The Packet Sniffer sensor monitors the headers of data packets that pass a local network card using a built-in packet sniffer. You can choose from predefined channels. It can show the following and more:
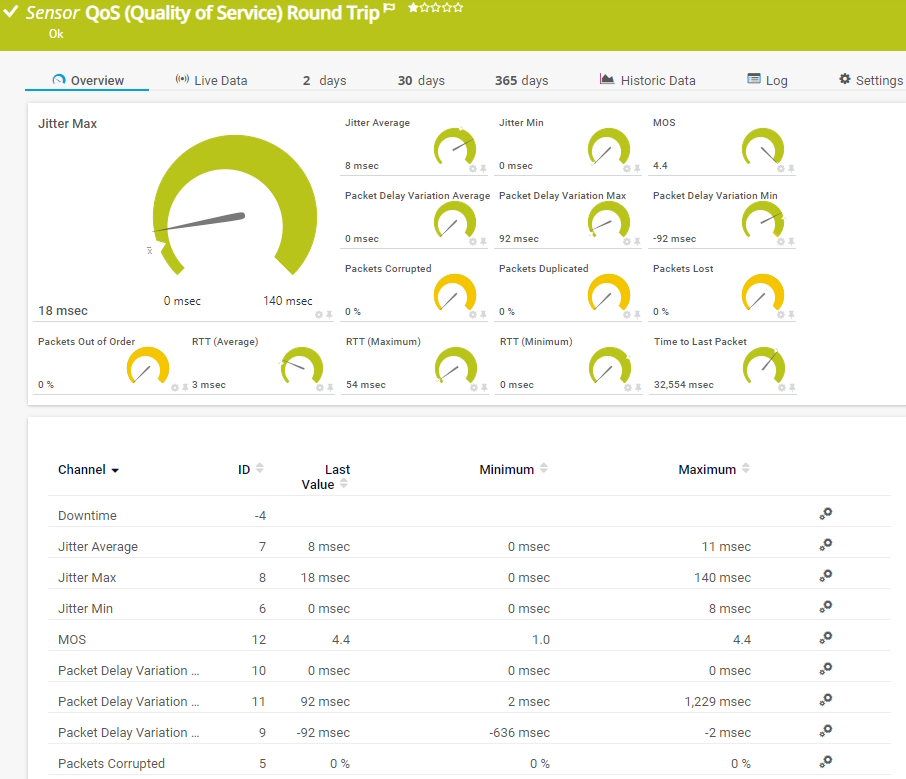
The QoS (Quality of Service) Round Trip sensor monitors parameters regarding the quality of a network connection between two probes. It can show the following:
See the PRTG Manual for a list of all available sensor types.

Custom alerts and data visualization let you quickly identify and prevent network connectivity issues.
PRTG is set up in a matter of minutes and can be used on a wide variety of mobile devices.


“Excellent tool for detailed monitoring. Alarms and notifications work greatly. Equipment addition is straight forward and server initial setup is very easy. ...feel safe to purchase it if you intend to monitor a large networking landscape.”
Partnering with innovative IT vendors, Paessler unleashes synergies to create
new and additional benefits for joined customers.
By integrating PRTG with Martello iQ, you can add a fast analytics layer to improve uptime, visualize your IT environment, and integrate all of your IT systems into a single pane of glass.
IT that works constitutes a business-critical basis for a company's success. Availability and security must be defined for the respective purpose and closely monitored – by OT and IT alike.
Siemon and Paessler bring together intelligent building technology and advanced monitoring and make your vision of intelligent buildings and data centers become reality.
Real-time notifications mean faster troubleshooting so that you can act before more serious issues occur.
Network Monitoring Software – Version 25.3.110.1313 (August 27, 2025)
Download for Windows and cloud-based version PRTG Hosted Monitor available
English, German, Spanish, French, Portuguese, Dutch, Russian, Japanese, and Simplified Chinese
Network devices, bandwidth, servers, applications, virtual environments, remote systems, IoT, and more
Choose the PRTG Network Monitor subscription that's best for you
An SD-WAN monitoring tool provides visibility into Software-Defined Wide Area Networks by tracking performance metrics across both overlay and underlay networks. These tools help you to monitor WAN connections between branch offices, data centers, and cloud environments. Good SD-WAN monitoring solutions track metrics like latency, jitter, packet loss, and bandwidth utilization while providing insights into how traffic flows between locations. They also help optimize network performance and troubleshoot issues across distributed network topologies.
PRTG monitors SD-WAN networks through multiple specialized sensors that track key performance indicators across your entire network topology. Our platform collects data from routers, firewalls, and edge devices using protocols like SNMP, NetFlow, and API integrations. PRTG provides real-time dashboards showing WAN traffic patterns, application performance, and connectivity status between sites. You can monitor both traditional MPLS connections and internet-based VPN tunnels from a single interface. Our solution also enables you to set thresholds and receive alerts when network performance issues arise, allowing for proactive troubleshooting before users experience problems.
The most important metrics to monitor in your SD-WAN environment include latency (delay in data transmission), jitter (variation in packet delay), packet loss (percentage of packets that fail to reach their destination), and bandwidth utilization across WAN links. You should also track application performance, TCP connection quality, and VPN tunnel status. For SD-WAN policies enforcement, monitor Quality of Service (QoS) parameters to ensure critical applications receive proper prioritization. Additionally, track the health of edge devices, orchestrator connectivity, and the status of connections between your data centers, branch offices, and cloud services.
Yes, PRTG can monitor specific SD-WAN solutions including Cisco SD-WAN, VMware SD-WAN, and other major vendors. The platform uses vendor-specific sensors and API integrations to collect detailed performance data from SD-WAN controllers and edge devices. For Cisco SD-WAN environments, PRTG can monitor the health of vManage orchestrators, edge routers, and the overlay network. The solution provides visibility into Cisco devices through dedicated sensors while also monitoring the underlying network infrastructure that supports your SD-WAN deployment.
You can optimize WAN traffic by using PRTG monitoring data to identify bottlenecks, inefficient routing paths, and underutilized links. The platform helps you analyze network traffic patterns to determine which applications consume the most bandwidth and when peak usage occurs. With this information, you can adjust SD-WAN policies to better prioritize business-critical applications, implement more effective QoS settings, and optimize traffic routing between locations. PRTG also helps identify when it's time to upgrade bandwidth at specific sites or when to reconfigure failover connections for better resilience.
SD-WAN monitoring differs from traditional WAN monitoring by focusing on both the overlay (virtual) network and the underlay (physical) infrastructure. While traditional WAN monitoring primarily tracks MPLS circuits and physical connections, SD-WAN monitoring must also track the software-defined aspects like dynamic path selection, application routing policies, and virtualized network functions. SD-WAN monitoring tools need to aggregate data from multiple connection types (MPLS, broadband, 4G/5G) and provide visibility into how traffic is being steered across these connections. They must also monitor the orchestrator and controllers that manage the SD-WAN functionality and track SaaS application performance across the distributed network.
Endpoint monitoring is crucial in SD-WAN environments as it helps ensure optimal user experience regardless of location. By monitoring endpoints like laptops, mobile devices, and IoT devices, you can verify that SD-WAN policies are delivering the expected application performance to end users. PRTG can track endpoint connectivity to critical applications, measure response times from different locations, and identify issues with specific network paths. This endpoint-centric view complements the network-centric monitoring and helps IT teams understand the actual user experience. Comprehensive endpoint monitoring also helps with security by tracking unusual traffic patterns that might indicate security threats or policy violations across your SD-WAN deployment.
In PRTG, “sensors” are the basic monitoring elements. One sensor usually monitors one measured value in your network, for example the traffic of a switch port, the CPU load of a server, or the free space on a disk drive. On average, you need about 5-10 sensors per device or one sensor per switch port.
Paessler conducted trials in over 600 IT departments worldwide to tune its network monitoring software closer to the needs of sysadmins. The result of the survey: over 95% of the participants would recommend PRTG – or already have.

Paessler PRTG is used by companies of all sizes. Sysadmins love PRTG because it makes their job a whole lot easier.
Bandwidth, servers, virtual environments, websites, VoIP services – PRTG keeps an eye on your entire network.
Everyone has different monitoring needs. That’s why we let you try PRTG for free.