Custom alerts and data visualization let you quickly identify and prevent network connection problems.
Are connectivity issues consuming too much of your time? Whether you're managing a small business network or enterprise infrastructure, you need clear visibility into every connection point and component. Paessler PRTG gives you complete network monitoring through SNMP, WMI, packet sniffing, and flow technologies. Monitor internet connections, track network performance, and resolve issues faster with detailed performance insights. Let continuous monitoring handle your daily checks while you work on improving your IT infrastructure.

Your network spans multiple protocols, devices, and locations? PRTG shows you data from your internet connection, LAN performance, and WAN links to give you the full picture. Monitor traffic flows between your network segments, endpoint connectivity, and overall network performance.
Check response times, packet loss rates, and traffic patterns across your ethernet connections to spot bottlenecks quickly. Keep a close eye on your ISP performance and internet connection stability while keeping detailed uptime statistics for every network component.
Monitor routers, switches, firewalls, and Wi-Fi access points through a single interface. Track IP address conflicts, bandwidth utilization, and connectivity issues across all endpoints. Get the optimal user experience by monitoring both LAN and WAN connections with precision.
Set up connectivity monitoring across all your distributed sites. Remote probes in PRTG monitor internet connections, WAN performance, and local network metrics at each location. This enables you to track network performance through real-time metrics like DNS resolution times or ISP performance.
Diagnose network issues by continuously tracking packet loss and latency. Show response time, bandwidth usage, and other key metrics in real time. Visualize monitoring data in clear graphs and dashboards to identify problems more easily. Gain the overview you need to troubleshoot connectivity issues.

Device tree view of the complete monitoring setup

Custom PRTG dashboard for keeping an eye on the entire IT infrastructure

Live traffic data graph in PRTG
“All-around winning
network monitor”
“The real beauty of PRTG is the endless possibilities it offers”
“PRTG Network Monitor
is very hard to beat”
When connectivity issues arise, every second counts. PRTG turns monitoring data into quick responses through alerts, real-time analysis, and notifications. Keep your network running with automated monitoring processes that puts you in control.
Set exact thresholds for outages, latency spikes, and performance drops in your network segments. PRTG monitors connectivity based on your defined values and sends instant notifications via email, SMS, or push messages. Create escalation rules that match your service level agreements and response procedures.
See your network status in customizable dashboards and maps. PRTG displays bandwidth usage, packet loss, and response times in real-time graphs. Monitor TCP connections, DNS resolution times, and overall network health through the web interface or PRTG mobile apps.
Connect PRTG with your existing IT tools through the REST API. Add custom sensors for specific monitoring needs or create your own notification methods. The API lets you automate responses to network events while supporting your established workflows.
Create detailed reports about network performance and connectivity status. PRTG generates graphs of your traffic patterns and bandwidth usage over time. Compare historical data across different timeframes to optimize your network setup and plan capacity upgrades.
PRTG comes with more than 250 native sensor types for monitoring your entire on-premises, cloud, and hybrid cloud environment out of the box. Check out some examples below!
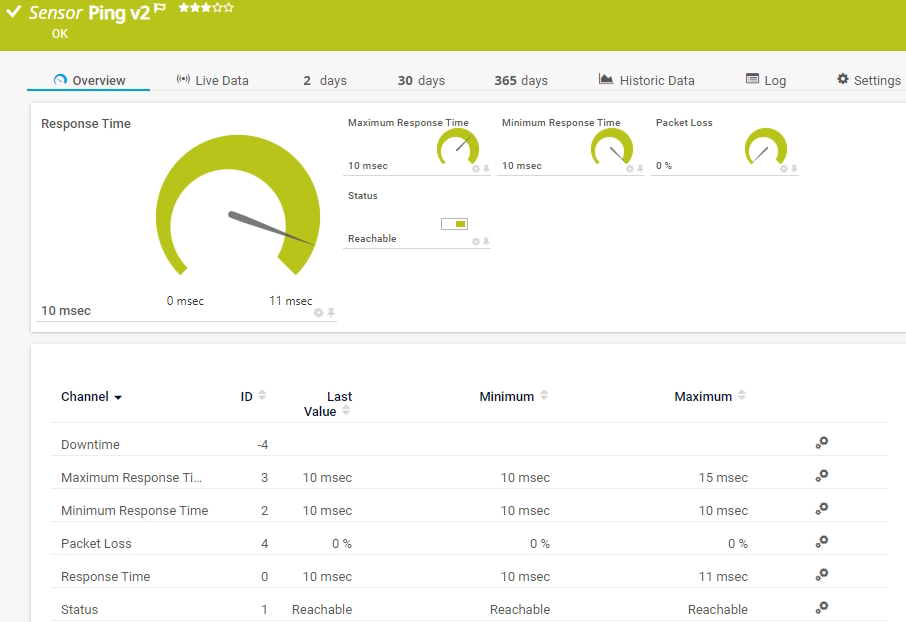
The Ping v2 sensor sends an Internet Control Message Protocol (ICMP) echo request ("ping") from the probe system to the parent device to monitor its availability. It can show the following:
• Response time
• Packet loss
• Target status
• Minimum and maximum ping time
The SNMP Traffic v2 sensor monitors bandwidth and traffic on a device. It can show the following:
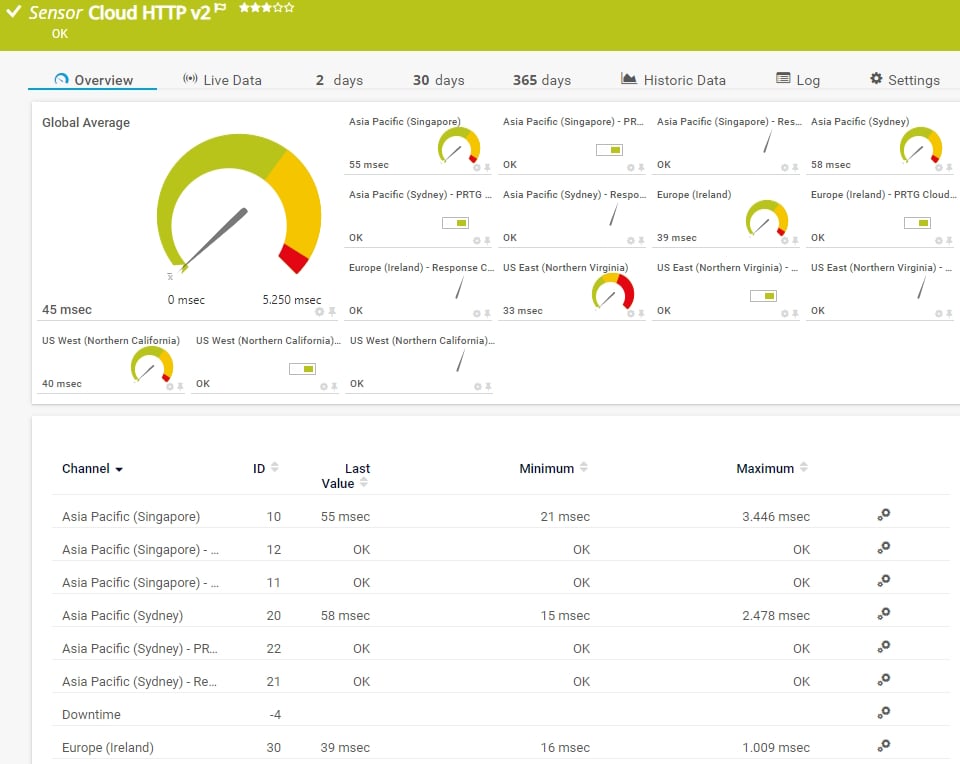
The Cloud HTTP v2 sensor monitors the loading time of a web server via HTTP from different locations worldwide (Asia Pacific: Singapore, Asia Pacific: Sydney, Europe: Ireland, US East: Northern Virginia, US West: Northern California) via the PRTG Cloud. It can show the following:
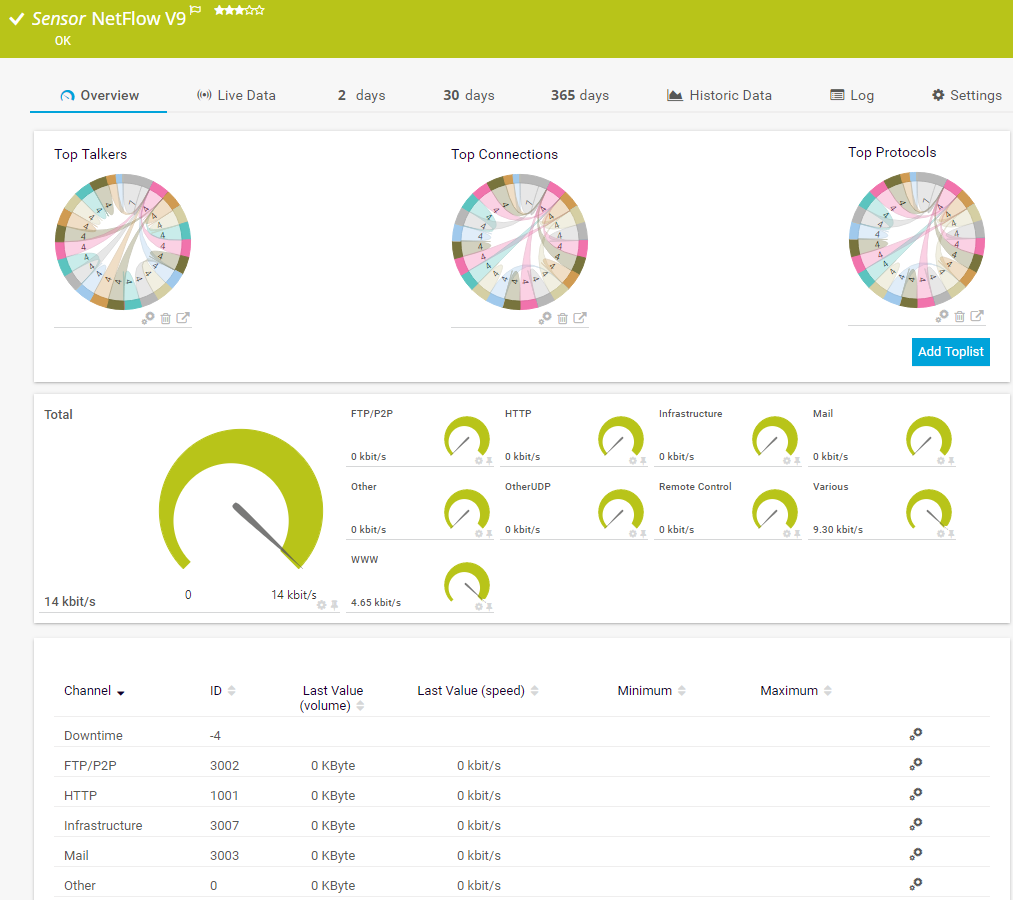
The NetFlow v9 sensor receives traffic data from a NetFlow v9-compatible device and shows the traffic by type. This sensor has several filter options to divide traffic into different channels. It can show the following and more:
See the PRTG Manual for a list of all available sensor types.

Custom alerts and data visualization let you quickly identify and prevent problems with network connectivity.
PRTG is set up in a matter of minutes and can be used on a wide variety of mobile devices.

As a member of the Cisco Partner Program, Paessler is one of the market leaders that enhances the Cisco technology portfolio with products that are proven to easily integrate with Cisco devices.
What does this mean for you?
Partnering with innovative IT vendors, Paessler unleashes synergies to create
new and additional benefits for joined customers.
baramundi and PRTG create a secure, reliable and powerful IT infrastructure where you have everything under control - from the traffic in your firewall to the configuration of your clients.
UVexplorer integrates tightly with PRTG to bring fast and accurate network discovery, detailed device inventory, and automatic network mapping to the PRTG platform.
Integrating monitoring results from PRTG into NetBrain maps makes the foundation for network automation.
Real-time notifications mean faster troubleshooting so that you can act before more serious issues occur.
Network Monitoring Software – Version 25.3.110.1313 (August 27, 2025)
Download for Windows and cloud-based version PRTG Hosted Monitor available
English, German, Spanish, French, Portuguese, Dutch, Russian, Japanese, and Simplified Chinese
Network devices, bandwidth, servers, applications, virtual environments, remote systems, IoT, and more
Choose the PRTG Network Monitor subscription that's best for you
PRTG uses SNMP, WMI, and packet sniffing to monitor your network connections. From basic ping checks to detailed bandwidth analysis, these technologies cover ethernet connections, Wi-Fi performance, and WAN links. Choose the right monitoring method based on your network devices and requirements.
PRTG tracks response times, packet loss rates, and bandwidth usage across your infrastructure. Monitor TCP connections, DNS resolution times, and ISP performance in real time. View network traffic patterns and endpoint connectivity status in clear graphs to spot potential issues quickly.
PRTG checks your network devices at regular intervals based on your settings. Define thresholds for routers, modems, and firewalls that match your requirements. When PRTG detects issues, it sends notifications through your configured channels, helping you fix problems before they affect your users.
The REST API in PRTG connects to your existing IT tools. Add custom sensors for specific monitoring tasks or create automated responses to network events. PRTG works with Microsoft technologies and common network management platforms, fitting right into your current IT setup.
Set up remote probes where you need them - they connect back to your PRTG server. Monitor internet connections and WAN performance at each site while tracking traffic between locations. Get metrics about network performance, VPN status, and site-to-site connections for your entire distributed network.
In PRTG, “sensors” are the basic monitoring elements. One sensor usually monitors one measured value in your network, for example the traffic of a switch port, the CPU load of a server, or the free space on a disk drive. On average, you need about 5-10 sensors per device or one sensor per switch port.
Paessler conducted trials in over 600 IT departments worldwide to tune its network monitoring software closer to the needs of sysadmins. The result of the survey: over 95% of the participants would recommend PRTG – or already have.

Paessler PRTG is used by companies of all sizes. Sysadmins love PRTG because it makes their job a whole lot easier.
Bandwidth, servers, virtual environments, websites, VoIP services – PRTG keeps an eye on your entire network.
Everyone has different monitoring needs. That’s why we let you try PRTG for free.