• Company
    • About Us
    • Case Studies
    • Press Center
    • Events
    • Careers
    • Blog
    • Contact us
  • Contact us
  • Login
 
  • English
    • Deutsch
    • Español
    • Français
    • Italiano
    • Português
Paessler
                    - The Monitoring Experts
  • Products
    • Paessler PRTG
      Paessler PRTGMonitor your whole IT infrastructure
      • PRTG Network Monitor
      • PRTG Enterprise Monitor
      • PRTG Hosted Monitor
      • PRTG extensionsExtensions for Paessler PRTGExtend your monitoring to a new level
    • Icon Features
      FeaturesExplore all monitoring features
      • Maps & dashboards
      • Alerts & notifications
      • Multiple user interfaces
      • Distributed monitoring
      • Customizable reporting
  • Solutions
    • Industries
      IndustriesMonitor various industry sectors
      • Industrial
      • Healthcare
      • Data Center
      • Education
      • Finance
      • Government
    • IT Topics
      IT TopicsMonitor all areas of IT
      • Network Monitoring
      • Bandwidth Monitoring
      • SNMP Monitor
      • Network Mapping
      • WiFi Monitoring
      • Server Monitoring
  • Pricing
  • Resources
    • Getting Started
      Getting StartedModules for self-paced learning
    • How-to Guides
      How-to GuidesGet the most out of PRTG
    • Videos & Webinars
      Videos & WebinarsLearn from Paessler experts
    • IT  Knowledge
      IT KnowledgeExpand your IT knowledge
    • PRTG Manual
      PRTG ManualFull documentation
    • Knowledge Base
      Knowledge BaseShare community knowledge
    • PRTG Sensor Hub
      PRTG Sensor HubGet sensors, scripts & templates
    • Trainings
      PRTG TrainingLearn how to work with PRTG
  • Partners
    • icon star
      New Partners and MSPBecome a new partner or MSP
    • icon partner
      Partner PortalLog in to your partner account
    • Deal Registration
      Deal RegistrationRegister your sales opportunities
    • icon search
      Find a PartnerFind partners selling Paessler products
    • icon technology
      Technology AlliancesSee Paessler technology partnerships
  • Company
    • About Us
    • Case Studies
    • Press Center
    • Events
    • Careers
    • Blog
    • Contact us
  • Contact us
  • Login
  • English
    • Deutsch
    • Español
    • Français
    • Italiano
    • Português
  • Get a quote
  • Free trial
  1. Home>
  2. IT Topics>
  3. Industrial IT>
  4. OPC UA Monitoring
PRTG Logo

OPC UA Monitoring with PRTG

Enhance operational efficiency of your converged IT/OT networks

  • Keep track of the health & availability of your OPC UA servers and clients
  • Identify errors at an early stage during the manufacturing process
  • Forward PRTG alerts to your OPC UA systems like SCADA or MES
Free download
product overview

Paessler PRTG is trusted by 500,000 users worldwide

Siemens
Truma
Bosch
rexroth
SMS group

PRTG OPC UA monitoring: What you will find on this page

Table of content
  • 4 reasons why to choose PRTG as your OPC UA monitoring tool
  • What OPC UA monitoring looks like in PRTG
  • How OPC UA monitoring with PRTG works
  • OPC UA Monitoring: FAQ

PRTG makes OPC UA server monitoring as easy as it gets

Custom alerts and data visualization let you quickly identify and prevent OT network issues.

Free download
PRODUCT OVERVIEW

4 reasons why to choose PRTG as your OPC UA monitoring tool

As information technology and operational technology become more and more converged, monitoring your infrastructure not only with classic IT protocols like SNMP, but also with industrial standards like OPC UA (OPC Unified Architecture) is becoming more important than ever. Paessler PRTG is your all-in-one network monitoring solution that comes with support for Modbus TCP, MQTT, and OPC UA out of the box – for a combined overview of your IT & OT networks.

icon search

Monitor converged IT/OT networks

Monitoring classic IT infrastructures and OT networks together does not have to be complicated. With PRTG’s preconfigured OPC UA sensors, you can monitor your OT devices without much configuration effort.

PRTG’s user-friendly web interface helps you to easily add devices, define notification triggers, and set up your monitoring environment the way you need.

icon dashboard

View from a central dashboard

Do away with checking IT and IIoT devices with multiple tools and on multiple dashboards. With OPC UA integration in PRTG, you get a combined overview of your classic IT and OPC UA devices – all in one place.

What’s more: The PRTG Map Editor functionality lets you easily create custom dashboards using drag and drop so that you have the status of all your critical devices and applications at a glance.

icon alarm

Receive custom alerts & notifications

Set individual warning and error thresholds and let our network monitoring tool do the work for you. With PRTG’s real-time alerts and customizable notification templates, you’re always notified in time.

Use OPC UA notifications, for example, to forward PRTG alerts by writing them to a predefined OPC UA tag on an OPC UA server like SCADA, DCS, or any other system that provides OPC UA server capability.

icon configuration

Implement predictive maintenance

When monitoring OT components, one of the most important goals is predictive maintenance. Prevent malfunctions and failures to avoid that production lines stop and high costs are incurred.

OPC UA monitoring with PRTG reliably informs you about the state of the various components of your production line, helps you with implementing a proactive approach to troubleshooting.

What OPC UA monitoring looks like in PRTG

Diagnose network issues by continuously tracking your entire IT and OT infrastructure. Show hardware status, uptime, session and subscription numbers, CPU usage, and more in real time. Visualize monitoring data in clear graphs and dashboards to identify problems more easily. Gain the overview you need to troubleshoot your OPC UA components and connections proactively.

PRTG Screenshot map Industrial Cabinet open

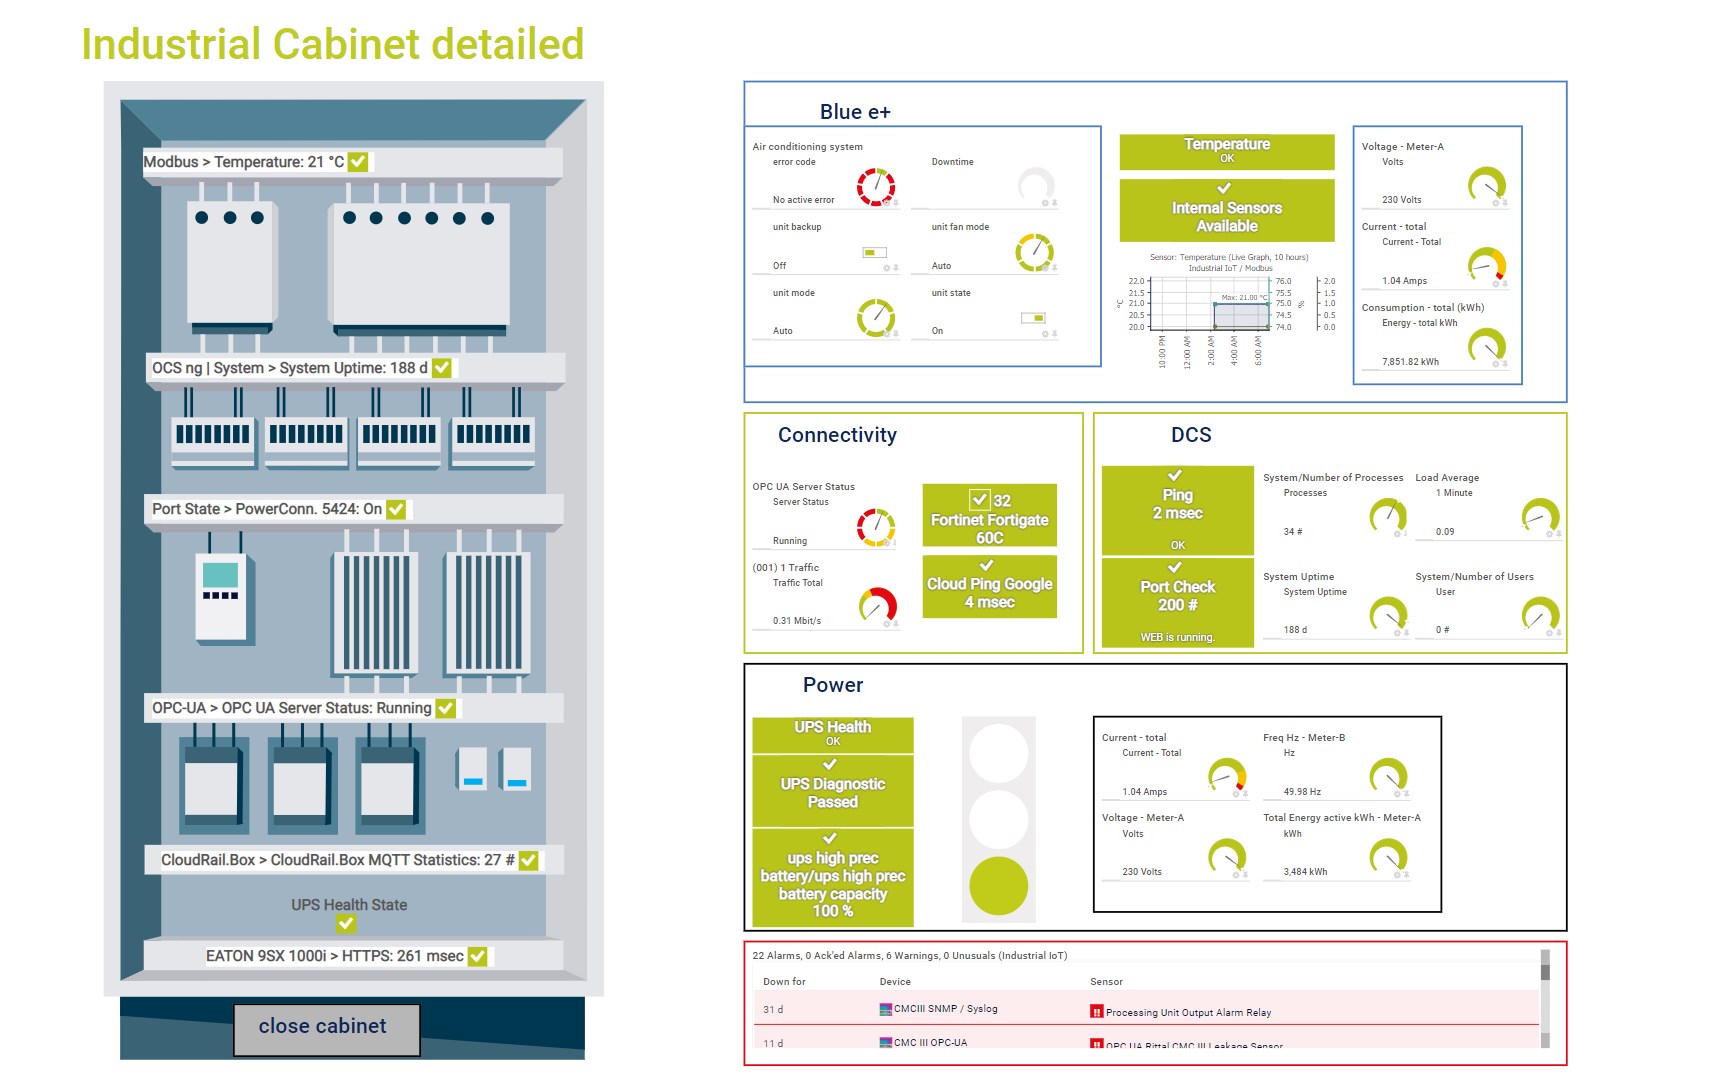
Full custom insight into your control cabinets with PRTG

PRTG Screenshot map rhebo uptime alliance

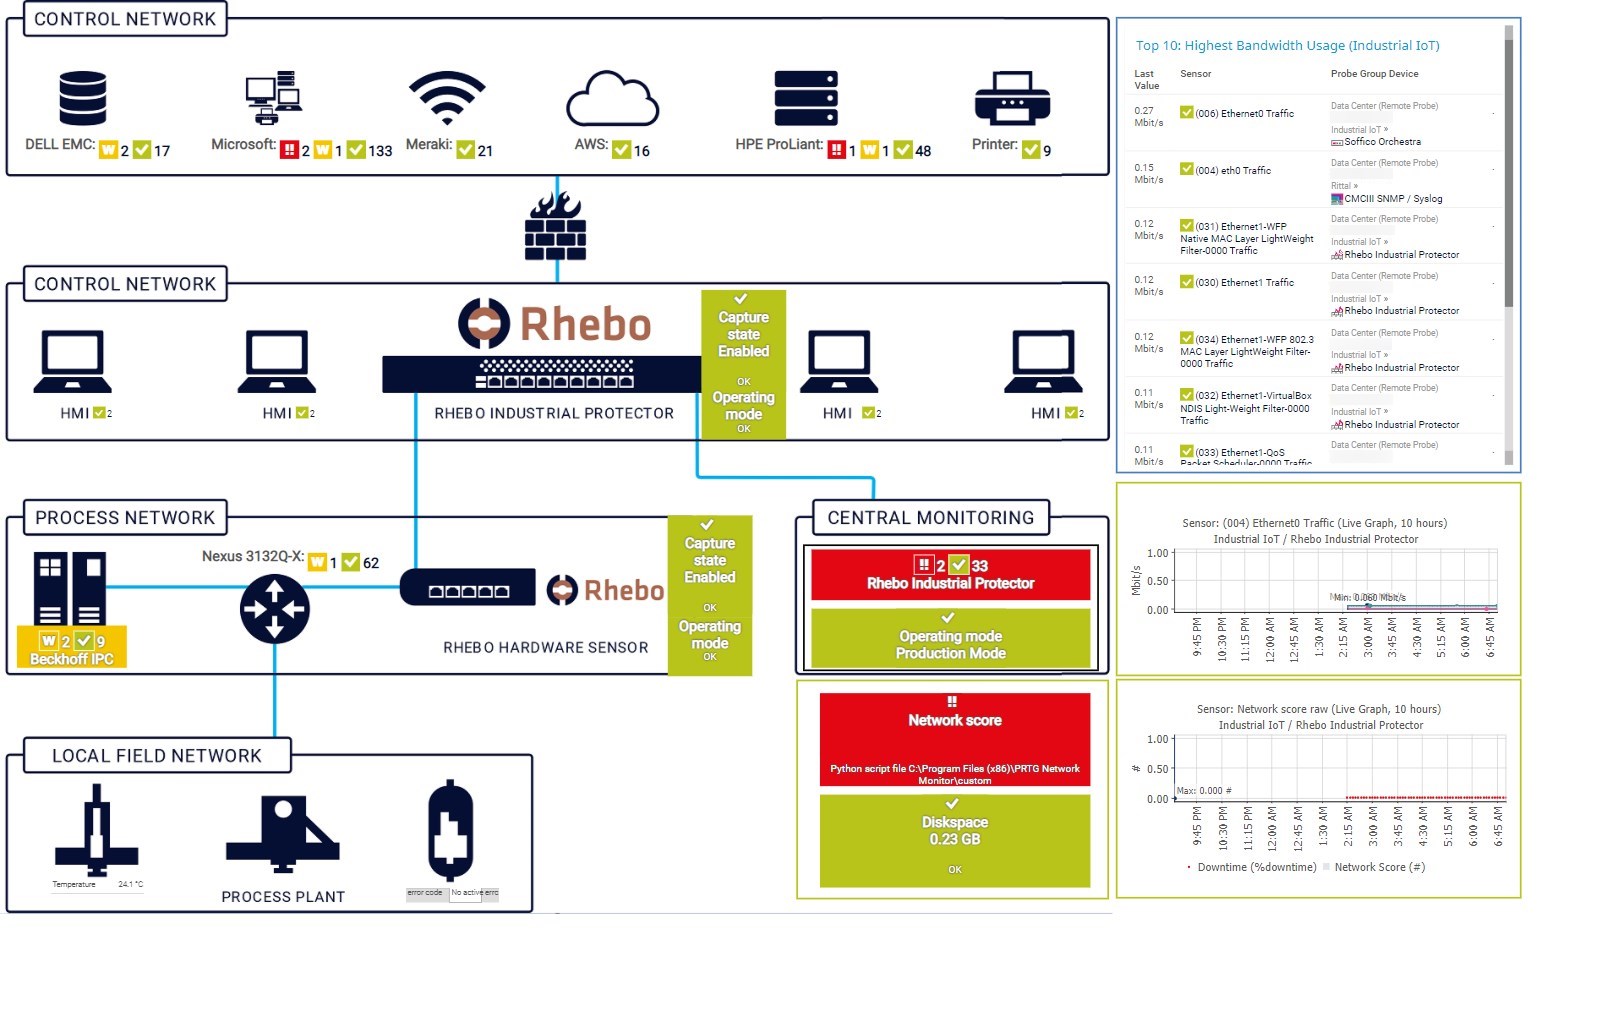
Comprehensive map of Rhebo with uptime alliance

PRTG Screenshot device tree view

Device tree view of the complete monitoring setup

PRTG screenshot map entire it infrastructure

Custom PRTG dashboard for keeping an eye on the entire IT infrastructure

PRTG screenshot graph live data traffic

Live traffic data graph in PRTG

Start monitoring using OPC UA with PRTG and see how it can make your network more reliable and your job easier.

Free download
PRODUCT OVERVIEW

An award-winning extension for Paessler PRTG to bridge IT and OT, as voted by readers

computer automation

Awarded 3rd place in the 
Software & IT category

ned innovation award

Winner in the Software & 
Computers category

How OPC UA monitoring with PRTG works

PRTG comes with more than 250 native sensor types for monitoring your entire on-premises, cloud, and hybrid cloud environment out of the box. Check out some examples below!

OPC UA Server Status

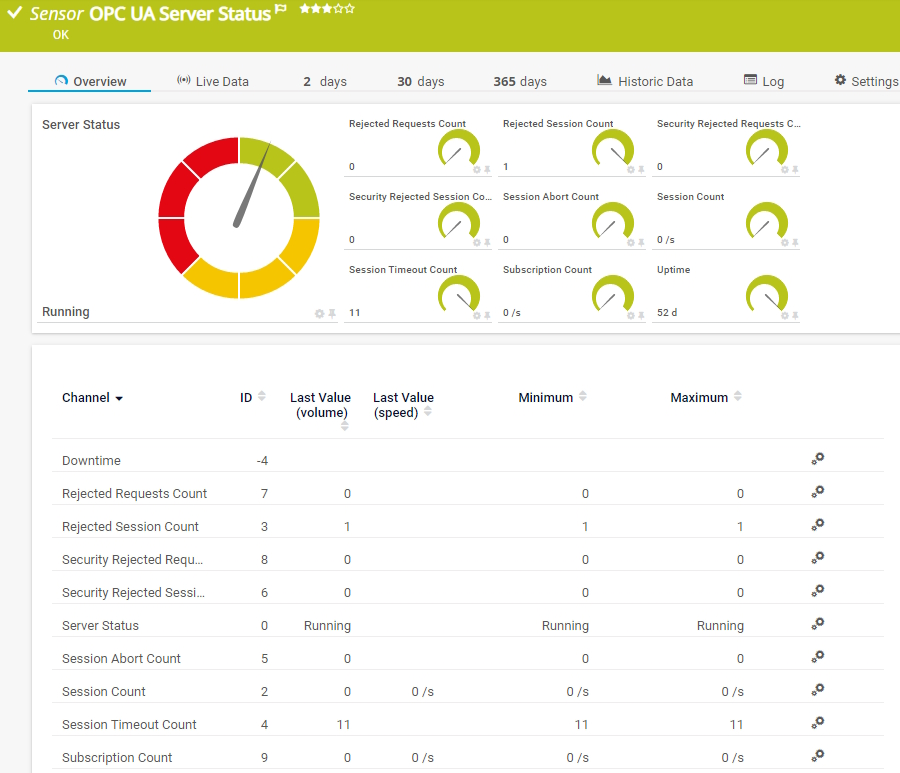
The OPC UA Server Status sensor monitors the server status, uptime, and diagnostic information of an OPC Unified Architecture (OPC UA) server. It can show the following:

  • Server status
  • Uptime
  • Number of rejected requests and sessions
  • Number of security-rejected requests and sessions
  • Number of subscriptions, sessions, session timeouts, and session aborts
OPC UA Server Status

OPC UA Custom

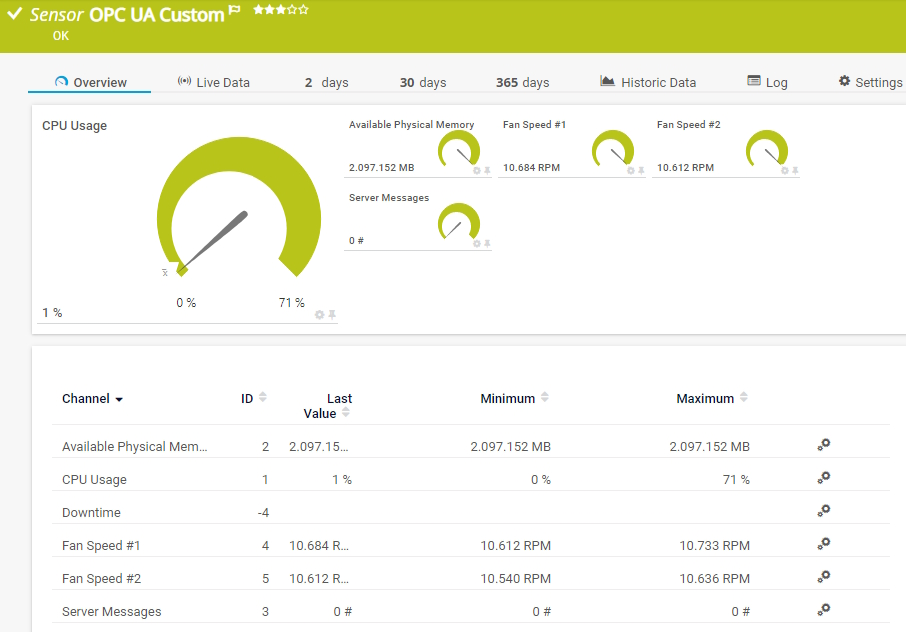
The OPC UA Custom sensor monitors up to ten numeric values returned by specific OPC Unified Architecture (OPC UA) NodeIDs. It can show the following:

  • Downtime
  • Returned numeric values in up to ten channels
OPC UA Custom
OPC UA Custom

OPC UA Certificate

The OPC UA Certificate sensor monitors the certificate of an OPC Unified Architecture (OPC UA) server. It can show the following:

  • Number of days to expiration
  • Public key length
  • If a self-signed certificate is used
OPC UA Certificate
OPC UA Certificate

Beckhoff IPC System Health

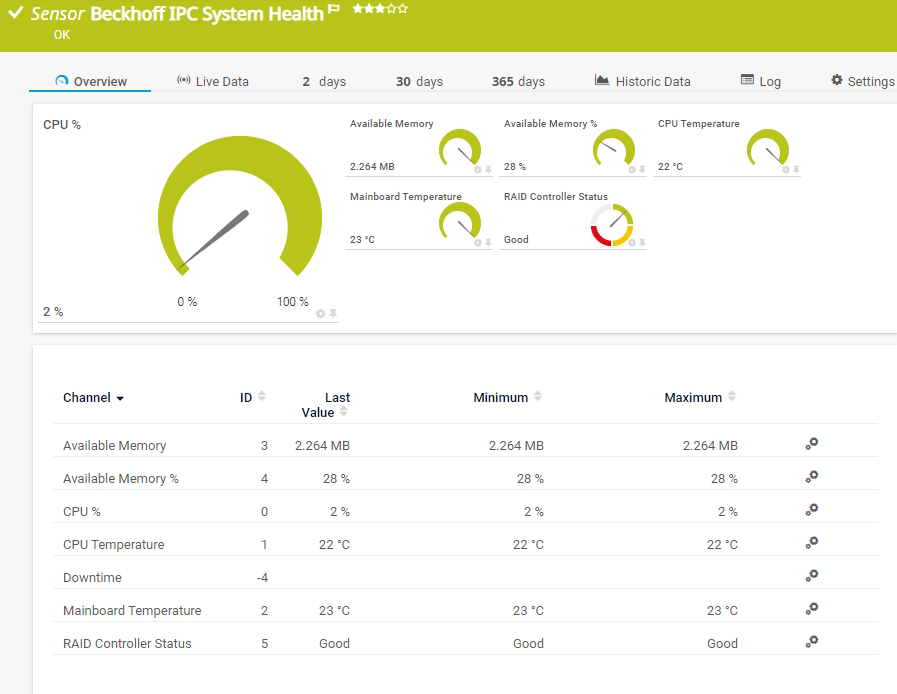
The Beckhoff IPC System Health sensor monitors the system health of a Beckhoff Industrial PC (IPC) via OPC Unified Architecture (OPC UA). It can show the following:

  • Available memory
  • CPU load
  • CPU and mainboard temperature
  • RAID controller status
Beckhoff IPC System Health

See the PRTG Manual for a list of all available sensor types.

PRTG is compatible with all major vendors, products, and systems

compatible with all major vendors, products, and systems

Find the root cause of the problem with our PRTG OPC UA monitoring solution

Real-time notifications mean faster troubleshooting so that you can act before more serious issues occur.

Free download
PRODUCT OVERVIEW

“PRTG has become an essential part of the entire plant production process, from planning to acceptance by the customer. So much so that we are currently toying with the idea of expanding our portfolio to offer support for plants, even after they are operational.”

Frank Schweisfurth
SMS group

“We have known PRTG for many years. We have selected this solution because it integrates natively into the industrial operational technology environments that we offer to our customers in the region.”

Miguel Ángel López Ávila, General Manager
SE3

“We appreciate the flexibility of PRTG and how it grows together with the company, supporting our needs to also digitalize the factory floor and monitor not only standard IT infrastructure but also factory equipment.”

Sandeep Rai, Network and Security Team Lead
Nobia AB

“In the past, the enterprise and the industrial network were completely separated with very different requirements, such as security versus productivity. We see that within OT, monitoring is not widely used yet for several reasons, but processes are depending on IT systems more and more. The need for a reliable OT network is growing rapidly, and that’s where PRTG comes in.”

Pascal Vercammen, Digitalization & IT Department Manager
Process Automation Solutions

Your OPC UA monitor at a glance – even on the go

PRTG is set up in a matter of minutes and can be used on a wide variety of mobile devices.

device overview

Create innovative solutions with Paessler’s IT partners

Partnering with innovative IT vendors, Paessler unleashes synergies to create
new and additional benefits for joined customers.

Rittal

Rittal

IT that works constitutes a business-critical basis for a company's success. Availability and security must be defined for the respective purpose and closely monitored – by OT and IT alike.

Read more
NetBrain

NetBrain

Integrating monitoring results from PRTG into NetBrain maps makes the foundation for network automation.

Read more
ScriptRunner

ScriptRunner

With ScriptRunner Paessler integrates a powerful event automation platform into PRTG Network Monitor.

Read more

PRTG makes OPC UA server monitoring as easy as it gets

Real-time notifications mean faster troubleshooting so that you can act before more serious issues occur.

Free download
PRODUCT OVERVIEW
Paessler PRTG

Paessler PRTG

Network Monitoring Software – Version 25.2.106.1114 (May 05th, 2025)

Hosting icon

Hosting

Download for Windows and cloud-based version PRTG Hosted Monitor available

Languages icon

Languages

English, German, Spanish, French, Portuguese, Dutch, Russian, Japanese, and Simplified Chinese

test

Monitor everything

Network devices, bandwidth, servers, applications, virtual environments, remote systems, IoT, and more

test

Pricing

Choose the PRTG Network Monitor subscription that's best for you

Discover more monitoring insights and stories

Resources Solution

Solutions for all your monitoring needs

  • PRTG OPC UA Server – industrial network management software
  • Paessler AG’s PRTG OPC UA Server wins New Equipment Digest’s Innovation Awards in Software & Computer Category
  • FAQ for Paessler PRTG OPC UA Server
Resources Content

Powerful stories from the monitoring world

  • How to send PRTG notifications to an OPC UA server
  • Announcing Paessler PRTG OPC UA Server
  • Introducing the new OPC UA sensors for monitoring industrial devices
Resources Solutions

Resources to master your monitoring challenges

  • OPC UA Custom Sensor
  • OPC UA Certificate Sensor
  • OPC UA Server Status Sensor

OPC UA Monitoring: FAQ


What is OPC UA?

OPC UA (short for Open Platform Communications Unified Architecture) is a data exchange standard for industrial communication (machine-to-machine or PC-to-machine communication). It is a platform-independent communication framework that runs on any software platform like Windows, Linux, macOS, or Android.

The open interface standard is also independent from the manufacturer or system supplier of the application or the programming language in which the respective software was programmed. Security is baked into the protocol for access control, authentication, and encryption.

Because of its flexibility, OPC UA has been widely adopted in industries like automotive, food and beverage, oil and gas, energy and utilities, packaging, and building automation.

Watch our 2-minute video on OPC UA

How does OPC UA work?

OPC UA enables access to machines, devices, and other endpoints. Its architecture is designed as follows:

  • OPC UA server: The OPC server is the basis of OPC communication. It is a software program that implements the OPC standard and thus provides the standardized OPC UA interfaces to the outside world. The proprietary communication protocol for the manufacturer's control is implemented inside. OPC UA servers are provided by various parties.
  • OPC UA client: The OPC UA client is the logical counterpart to the OPC UA server. The OPC UA client can be connected to the OPC UA server and read out the data provided by the server. Since the OPC UA servers implement the specified interfaces of the OPC UA standard, each client can access any OPC UA server and exchange data with the server in the same way.
Infographic on how OPC UA works
What is OPC UA monitoring?

OPC UA monitoring refers to the process of observing, tracking, and analyzing data and events within an OPC UA-enabled system. OPC UA is a machine-to-machine communication protocol for industrial automation, providing interoperability and secure data exchange between devices and systems from different manufacturers.

Monitoring using OPC UA usually involves collecting real-time data from various devices and systems within an industrial environment, detecting specific events or changes in the state of devices, and analyzing collected data to gain insights into the performance and health of the equipment and processes.

Does PRTG support other industrial protocols?

Paessler PRTG is a comprehensive monitoring tool that supports a wide range of industrial standards and protocols to monitor various aspects of industrial IT infrastructure, including:

  • Modbus TCP
  • MQTT (Message Queueing Telemetry Protocol)
  • IPMI and Redfish

It also comes with preconfigured sensor types for manufacturers such as Rittal or Beckhoff.

What is OPC UA monitoring with PRTG versus PRTG OPC UA Server?

With PRTG, you can monitor the status and health of every system that supports OPC UA.

To bring PRTG alarms and metrics directly into a control and supervisory system like SCADA, you need our product extension Paessler PRTG OPC UA Server.

What is a sensor in PRTG?

In PRTG, “sensors” are the basic monitoring elements. One sensor usually monitors one measured value in your network, for example the traffic of a switch port, the CPU load of a server, or the free space on a disk drive. On average, you need about 5-10 sensors per device or one sensor per switch port.

We asked: would you recommend PRTG? Over 95% of our customers say yes!

Paessler conducted trials in over 600 IT departments worldwide to tune its network monitoring software closer to the needs of sysadmins. The result of the survey: over 95% of the participants would recommend PRTG – or already have.

recommendation

Still not convinced?

Love

More than 500,000 sysadmins love PRTG

Paessler PRTG is used by companies of all sizes. Sysadmins love PRTG because it makes their job a whole lot easier.

PRTG

Monitor your entire IT infrastructure

Bandwidth, servers, virtual environments, websites, VoIP services – PRTG keeps an eye on your entire network.

test

Try Paessler PRTG for free

Everyone has different monitoring needs. That’s why we let you try PRTG for free.

PRTG Logo

Start monitoring using OPC UA with PRTG and see how it can make your network more reliable and your job easier.

Free download
PRODUCT OVERVIEW

Products

  • Paessler PRTG
    Paessler PRTGMonitor your whole IT infrastructure
    • PRTG Network Monitor
    • PRTG Enterprise Monitor
    • PRTG Hosted Monitor
    • PRTG extensions
      Extensions for Paessler PRTGExtend your monitoring to a new level
  • Icon Features
    FeaturesExplore all monitoring features

Monitoring with PRTG

  • Network monitoring
  • Bandwidth monitoring
  • SNMP monitoring
  • Network mapping
  • Wi-Fi monitoring
  • Server monitoring
  • Network traffic analyzer
  • NetFlow monitoring
  • Syslog server

Useful Links

  • PRTG Manual
  • Knowledge Base
  • Customer Success Stories
  • About Paessler
  • Subscribe to newsletter
  • PRTG Support
  • PRTG Consulting

Contact

Paessler GmbH
Thurn-und-Taxis-Str. 14, 
90411 Nuremberg 
Germany

[email protected]

+49 911 93775-0

  • Contact us
©2025 Paessler GmbHTerms & ConditionsPrivacy PolicyImprintReport VulnerabilityDownload & InstallSitemap
Home Home Home