• Company
    • About Us
    • Case Studies
    • Press Center
    • Events
    • Careers
    • Blog
    • Contact us
  • Contact us
  • Login
 
  • English
    • Deutsch
    • Español
    • Français
    • Italiano
    • Português
Paessler
                    - The Monitoring Experts
  • Products
    • Paessler PRTG
      Paessler PRTGMonitor your whole IT infrastructure
      • PRTG Network Monitor
      • PRTG Enterprise Monitor
      • PRTG Hosted Monitor
      • PRTG extensionsExtensions for Paessler PRTGExtend your monitoring to a new level
    • Icon Features
      FeaturesExplore all monitoring features
      • Maps & dashboards
      • Alerts & notifications
      • Multiple user interfaces
      • Distributed monitoring
      • Customizable reporting
  • Solutions
    • Industries
      IndustriesMonitor various industry sectors
      • Industrial
      • Healthcare
      • Data Center
      • Education
      • Finance
      • Government
    • IT Topics
      IT TopicsMonitor all areas of IT
      • Network Monitoring
      • Bandwidth Monitoring
      • SNMP Monitor
      • Network Mapping
      • WiFi Monitoring
      • Server Monitoring
  • Pricing
  • Resources
    • Getting Started
      Getting StartedModules for self-paced learning
    • How-to Guides
      How-to GuidesGet the most out of PRTG
    • Videos & Webinars
      Videos & WebinarsLearn from Paessler experts
    • IT  Knowledge
      IT KnowledgeExpand your IT knowledge
    • PRTG Manual
      PRTG ManualFull documentation
    • Knowledge Base
      Knowledge BaseShare community knowledge
    • PRTG Sensor Hub
      PRTG Sensor HubGet sensors, scripts & templates
    • Trainings
      PRTG TrainingLearn how to work with PRTG
  • Partners
    • icon star
      New Partners and MSPBecome a new partner or MSP
    • icon partner
      Partner PortalLog in to your partner account
    • Deal Registration
      Deal RegistrationRegister your sales opportunities
    • icon search
      Find a PartnerFind partners selling Paessler products
    • icon technology
      Technology AlliancesSee Paessler technology partnerships
  • Company
    • About Us
    • Case Studies
    • Press Center
    • Events
    • Careers
    • Blog
    • Contact us
  • Contact us
  • Login
  • English
    • Deutsch
    • Español
    • Français
    • Italiano
    • Português
  • Get a quote
  • Free trial
  1. Home>
  2. IT Topics>
  3. Cloud>
  4. Azure Monitoring
PRTG Logo

Azure Monitoring with PRTG

Keep your Azure environment healthy and your subscription costs in check

  • Benefit from all-in-one IT infrastructure & Azure monitoring services
  • Always know about your total & budget-specific Azure subscription costs
  • Be immediately alerted with customizable alerts & notifications
Free download
product overview

Our users give top ratings for monitoring with Paessler PRTG

Gartner peer insights
spiceworks
G2
Capterra

PRTG Azure monitoring: What you will find on this page

Table of content
  • Quick setup with preconfigured Microsoft Azure sensors
  • What Azure cloud monitoring looks like in PRTG
  • Native monitoring with Azure Monitor
  • Why PRTG is the perfect Azure monitoring tool for you
  • Explore our preconfigured PRTG sensors for Azure monitoring
  • Monitoring Azure: FAQ

PRTG makes Azure monitoring as easy as it gets

Custom alerts and data visualization let you quickly identify and prevent issues with your Microsoft Azure cloud environment.

Free download
PRODUCT OVERVIEW

Quick setup with preconfigured Microsoft Azure sensors

With Paessler PRTG, you get native sensors for monitoring your Azure resources out of the box. Just download and install PRTG, deploy a Microsoft Azure device by connecting your Azure account with PRTG, and add the PRTG Azure sensors you need.

icon monitoring

Monitor the health of your Azure VMs

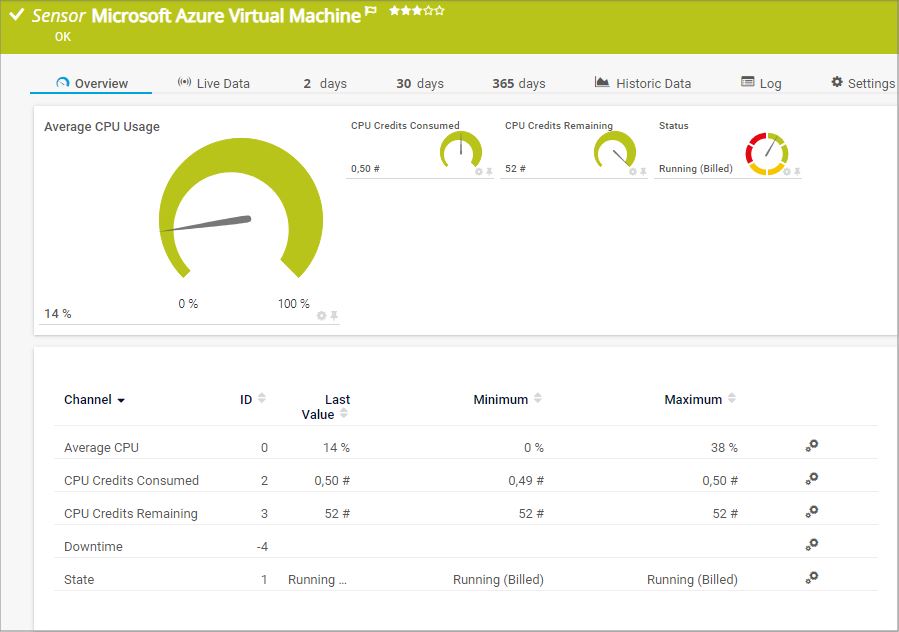
PRTG makes sure that your Microsoft Azure virtual machines are up and running around the clock. Its Microsoft Azure Virtual Machine sensor monitors the status of each VM in your Microsoft Azure subscription and displays the CPU usage as well as used and remaining CPU credits.

A quick glance is all it takes to determine whether your virtual machines are available and performing as expected.

icon money

Have your Azure subscription cost under control

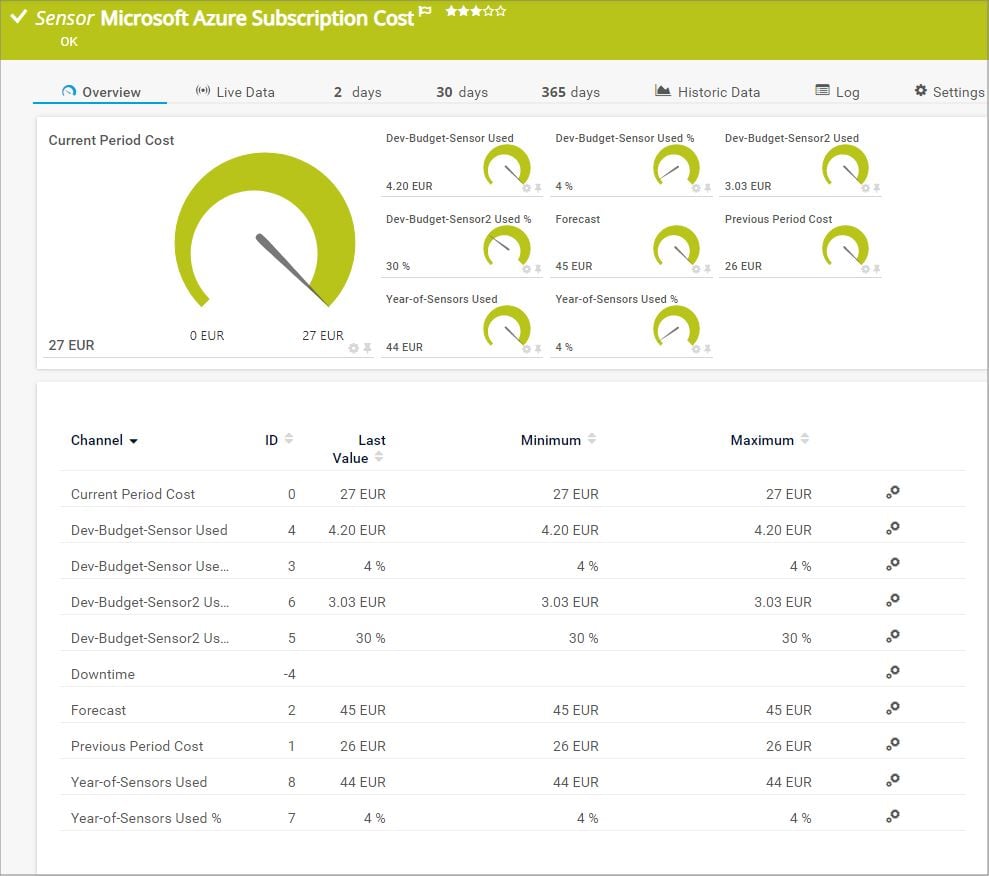
The Microsoft Azure Subscription Cost sensor monitors the cost of an Azure subscription. This includes the overall cost of the current and previous period as well as a cost forecast.

In addition, the sensor shows the used amount of a budget that you specified in your subscription. You can choose the specific budget during sensor setup.

icon server

Check the performance of your Azure storage account

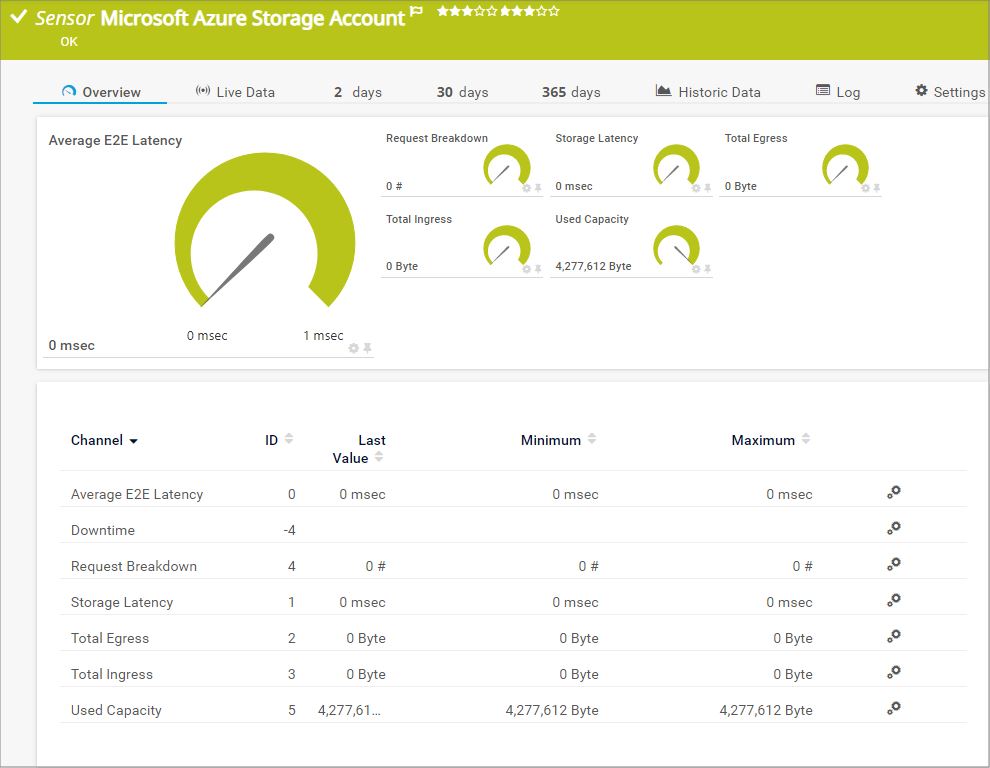
With the Microsoft Azure Storage Account sensor, you can ensure that everything is fine with the storage accounts in your Azure subscription.

The sensor lets you keep an eye on the average E2E latency, the storage latency, total ingress and egress, the used capacity, and the number of request breakdowns.

icon database

Get Azure SQL Database metrics at a glance

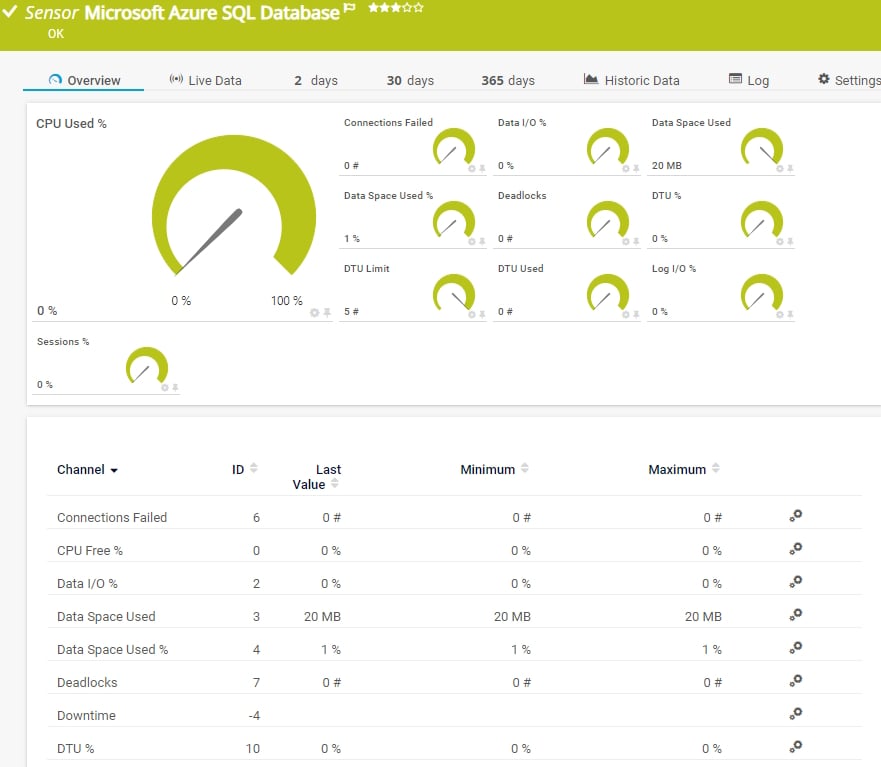
The Microsoft Azure SQL Database sensor monitors the metrics of an Azure SQL Database, either a single database or an elastic pool. This way, you can check if your database storage and processes are all working as intended.

The sensor monitors the number of failed connections and deadlocks, CPU and data space usage, data and log input and output, the session percentage, and more.

What Azure cloud monitoring looks like in PRTG

Diagnose network issues by continuously tracking the health and performance of your Azure virtual machines, storage accounts, and SQL databases. Show Azure alarms and performance metrics in real time. Visualize monitoring data in clear graphs and dashboards to identify problems more easily. Gain the overview you need to troubleshoot all kinds of issues with your cloud computing infrastructure as well as your entire network.

PRTG Screenshot device tree view

Device tree view of the complete monitoring setup

PRTG screenshot map entire it infrastructure

Custom PRTG dashboard for keeping an eye on the entire IT infrastructure

PRTG screenshot graph live data traffic

Live traffic data graph in PRTG

Start Azure services monitoring with PRTG and see how it can make your network more reliable and your job easier.

Free download
PRODUCT OVERVIEW

IT experts agree: Paessler PRTG is a great solution for IT infrastructure monitoring

PCMag

“All-around winning
 network monitor”

IT Brief

“The real beauty of PRTG is the endless possibilities it offers”

ITPro

“PRTG Network Monitor 
is very hard to beat”

The challenge: Native monitoring with Azure Monitor

If you have tried monitoring your Azure applications and services with Azure-native monitoring from Microsoft, you might have encountered several challenges.

icon one

Lack of consolidated monitoring

A typical Azure architecture is usually very complex and dynamic. Applications and services are made up of various siloed Azure resources (for example, virtual machines) and each resource needs to be monitored individually.

This means that to comprehensively monitor an Azure application or service, you must navigate between the different monitored resources or analyze different Azure Monitor logs to get the full picture.

icon two

Lack of easily customizable alerting

Microsoft Azure-native monitoring only allows you to set a very limited number of alerting conditions per rule.

This means that in order to be notified of an issue in a comprehensive way, you need to add multiple alerts for the same issue – and, of course, each alert costs extra.

In addition, notification methods are very limited and it is not possible to customize the available email notification templates.

icon three

Lack of monitoring the entire IT infrastructure

While Azure functions from Microsoft lets you monitor all kinds of metrics of an Azure resource itself, it is not possible to deploy it as a monitoring solution for monitoring your entire IT environment.

This means that in order to get insights into the full IT stack including hardware like servers, routers, and switches, or other operating systems and software, you need further monitoring tools – which will make monitoring not only more complicated, but also way more expensive than necessary.

The solution: Why PRTG is the perfect Azure monitoring tool for you

icon thumbs up

Keep an eye on your IT full-stack

PRTG monitors your complete IT infrastructure – no matter if you have an on-premises, hybrid, or cloud environment. Watch your Azure app services alongside everything else: as an all-in-one monitoring tool, every PRTG subscription includes more than 250 preconfigured sensors and out-of-the-box support for the most popular vendors.

icon map

Customize alerts & notifications

Sit back, relax, and let PRTG do the monitoring and alerting for you. If there is an issue with your Azure resources or any other problem in your ecosystem, PRTG alerts you immediately via highly customizable notifications. Define, for example, threshold values that trigger an alert, set granular alerting rules, and choose if you want to be informed via email, SMS, push notification, Teams or Slack message, and more.

icon sensor

Monitor Azure via easy-to-read dashboards

Gone are the days where you have to log in to each Azure resource separately to check their health status. PRTG provides you with a central overview that consolidates all your monitoring data in an easy-to-read dashboard. What’s more: with PRTG, you can create your own, customized maps and dashboards that show your Azure monitoring metrics the way you want - for an enhanced end-user experience.

Explore our preconfigured PRTG sensors for Azure monitoring

PRTG comes with more than 250 native sensor types for monitoring your entire on-premises, cloud, and hybrid cloud environment out of the box. Check out some examples below!

Microsoft Azure Virtual Machine

The Microsoft Azure Virtual Machine sensor monitors the status of a virtual machine (VM) in a Microsoft Azure subscription. It can show the following:

  • Average CPU load
  • Number of consumed CPU credits
  • Number of remaining CPU credits
  • VM status
Microsoft Azure Virtual Machine

Microsoft Azure Subscription Cost

The Microsoft Azure Subscription Cost sensor monitors the cost in a Microsoft Azure subscription. It can show the following:

  • Current period cost
  • Cost forecast
  • Used budget
  • Previous period cost
Microsoft Azure Subscription Cost

Microsoft Azure Storage Account

The Microsoft Azure Storage Account sensor monitors the storage account in a Microsoft Azure subscription. It can show the following:

  • Average E2E latency
  • Total number of requests made to the storage service
  • Latency of the storage
  • Total egress and ingress
  • Used capacity
Microsoft Azure Storage Account

Microsoft Azure SQL Database

The Microsoft Azure SQL Database sensor monitors the metrics of an Azure SQL Database (single database or elastic pool) in a Microsoft Azure subscription. It can show the following:

  • Number of failed connections and deadlocks
  • CPU and data space usage
  • Data I/O and log I/O operations
  • (e)DTUs, used (e)DTUs, and (e)DTU limit
Microsoft Azure SQL Database

See the PRTG Manual for a list of all available sensor types.

PRTG is compatible with all major vendors, products, and systems

compatible with all major vendors, products, and systems

PRTG makes Azure monitoring as easy as it gets

Custom alerts and data visualization let you quickly identify and prevent issues with your Microsoft Azure cloud environment.

Free download
PRODUCT OVERVIEW

“With PRTG, we can comprehensively monitor our email services in the cloud, and ensure that – as the team in charge – we are immediately informed in the event of a malfunction and can quickly take actions to fix it. It wasn’t until we started using PRTG that we realized how error-ridden our Microsoft cloud service can be.”

Monitoring expert
Oettinger Davidoff

“Part of our infrastructure runs with Azure. This information is then sent to PRTG via Powershell. Paessler is a great solution for us. We get alerts sent directly to our phones and if something goes wrong somewhere, we can immediately deal with it. It’s our lifeline. This is why Paessler gives us a sense of security no matter what the time of day.”

Gert-Jan Hiddink, DevOps Engineer
CowManager

“As more and more companies start to integrate new systems, they aren’t going to use legacy networks. Instead, clients are implementing more cloud-based solutions with newer programming languages. Being able to closely monitor cloud-based solutions and customize sensors based on clients’ needs is extremely helpful in making sure the process runs and continues to function as smoothly as possible.”

Edgard Concha, Director of Information Systems
Resolvit

Your Azure performance monitoring at a glance – even on the go

PRTG is set up in a matter of minutes and can be used on a wide variety of mobile devices.

device overview
Gartner peer insights

“Excellent tool for detailed monitoring. Alarms and notifications work greatly. Equipment addition is straight forward and server initial setup is very easy. ...feel safe to purchase it if you intend to monitor a large networking landscape.”

Read the complete review at Gartner Peer Insights

Create innovative solutions with Paessler’s IT partners

Partnering with innovative IT vendors, Paessler unleashes synergies to create
new and additional benefits for joined customers.

baramundi

baramundi

baramundi and PRTG create a secure, reliable and powerful IT infrastructure where you have everything under control - from the traffic in your firewall to the configuration of your clients.

Read more
INSYS icom

INSYS icom

With the combination of PRTG and Insys, the monitoring specialist Paessler and the industrial gateway manufacturer INSYS icom offer a practical possibility to merge IT and OT.

Read more
Siemon

Siemon

Siemon and Paessler bring together intelligent building technology and advanced monitoring and make your vision of intelligent buildings and data centers become reality.

Read more

Find the root cause of the problem with our PRTG Azure application performance monitoring solution

Real-time notifications mean faster troubleshooting so that you can act before more serious issues occur.

Free download
PRODUCT OVERVIEW
Paessler PRTG

Paessler PRTG

Network Monitoring Software – Version 25.2.106.1114 (May 05th, 2025)

Hosting icon

Hosting

Download for Windows and cloud-based version PRTG Hosted Monitor available

Languages icon

Languages

English, German, Spanish, French, Portuguese, Dutch, Russian, Japanese, and Simplified Chinese

test

Monitor everything

Network devices, bandwidth, servers, applications, virtual environments, remote systems, IoT, and more

test

Pricing

Choose the PRTG Network Monitor subscription that's best for you

Discover more monitoring insights and stories

Resources Solution

Solutions for all your monitoring needs

  • Virtual machine monitoring
  • Deeper Insights with AutoMonX and Paessler
  • PRTG Roadmap
Resources Content

Powerful stories from the monitoring world 

  • PRTG has embedded sensor types to monitor Microsoft Azure
  • PRTG Tutorial: Microsoft Azure Subscription Cost Sensor
  • How to deploy PRTG Network Monitor in AWS, Azure and GCP
Resources Solutions

Resources to master your monitoring challenges

  • Windows Azure Monitoring? Please!
  • Azure Monitoring
  • Microsoft Azure Virtual Machine Sensor

Azure Monitoring: FAQ


What is Microsoft Azure?

Microsoft Azure, formerly known as Windows Azure, is a public cloud computing platform from Microsoft. It offers a broad range of cloud services for all kinds of serverless IT operations, including Infrastructure as a Service (IaaS), Platform as a Service (PaaS), and Software as a Service (SaaS).

What is Azure monitoring?

Azure monitoring with Paessler PRTG keeps track of all the cloud services, VMs, critical applications, and the subscription costs of your Microsoft Azure infrastructure and visualizes all data on easy-to-read dashboards for easier workloads and improved workflows.

What is Azure Monitor?

Azure Monitor is a built-in service in the Azure cloud that offers basic monitoring functionalities. For a more sophisticated monitoring with custom alerts and a complete overview over your entire IT infrastructure, you should choose a professional tool like Paessler PRTG.

Why should I monitor my Azure Cloud Services?

By monitoring your Microsoft Azure Cloud, you cab assure all service are running smoothly. As soon as a problem occurs, you'll be notified immediately, and you'll be able to fix it quickly before great costs arise. 

What is a sensor in PRTG?

In PRTG, “sensors” are the basic monitoring elements. One sensor usually monitors one measured value in your network, for example the traffic of a switch port, the CPU load of a server, or the free space on a disk drive. On average, you need about 5-10 sensors per device or one sensor per switch port.

We asked: would you recommend PRTG? Over 95% of our customers say yes!

Paessler conducted trials in over 600 IT departments worldwide to tune its network monitoring software closer to the needs of sysadmins. The result of the survey: over 95% of the participants would recommend PRTG – or already have.

recommendation

Still not convinced?

Love

More than 500,000 sysadmins love PRTG

Paessler PRTG is used by companies of all sizes. Sysadmins love PRTG because it makes their job a whole lot easier.

PRTG

Monitor your entire IT infrastructure

Bandwidth, servers, virtual environments, websites, VoIP services – PRTG keeps an eye on your entire network.

test

Try Paessler PRTG for free

Everyone has different monitoring needs. That’s why we let you try PRTG for free.

PRTG Logo

Start Azure monitoring with PRTG and see how it can make your network more reliable and your job easier.

Free download
PRODUCT OVERVIEW

Products

  • Paessler PRTG
    Paessler PRTGMonitor your whole IT infrastructure
    • PRTG Network Monitor
    • PRTG Enterprise Monitor
    • PRTG Hosted Monitor
    • PRTG extensions
      Extensions for Paessler PRTGExtend your monitoring to a new level
  • Icon Features
    FeaturesExplore all monitoring features

Monitoring with PRTG

  • Network monitoring
  • Bandwidth monitoring
  • SNMP monitoring
  • Network mapping
  • Wi-Fi monitoring
  • Server monitoring
  • Network traffic analyzer
  • NetFlow monitoring
  • Syslog server

Useful Links

  • PRTG Manual
  • Knowledge Base
  • Customer Success Stories
  • About Paessler
  • Subscribe to newsletter
  • PRTG Support
  • PRTG Consulting

Contact

Paessler GmbH
Thurn-und-Taxis-Str. 14, 
90411 Nuremberg 
Germany

[email protected]

+49 911 93775-0

  • Contact us
©2025 Paessler GmbHTerms & ConditionsPrivacy PolicyImprintReport VulnerabilityDownload & InstallSitemap
Home Home Home