Custom alerts and data visualization let you quickly identify and prevent AWS service performance issues.
Paessler PRTG is essential for AWS cloud computing observability since cloud access is contingent on the perfect functioning of your internet connection and corresponding network devices, such as routers and switches.
Sit back, relax, and let PRTG monitor your entire IT infrastructure for you. Amazon cloud monitoring with PRTG provides you with an overview of the utilization of your resources, application performance, and the soundness of company processes.
PRTG helps to reduce risks in the cloud and configure your local network to best adapt to the cloud integration. Time spent troubleshooting is therefore kept to a minimum. PRTG lets you intervene quickly, allowing you to bypass many problems entirely for better end-user experience.
It shows you, for example, if your IT infrastructure is about to overload due to the large amount of data flowing across your lines and network devices while using the cloud. You can then take necessary steps to upgrade your system.
PRTG uses Amazon CloudWatch data to monitor Amazon Web Services and help you get to the root of the problem if crashes occur. Does the error lie with the Amazon server or cloud service, or with a local router? To find out, you'll need monitoring data from both the cloud and the local network.
PRTG comes with a variety of built-in AWS sensors for a number of services which allow for Amazon CloudWatch data to be effortlessly integrated into your monitoring solution. With PRTG, you can monitor cloud data centrally along with the data from your local IT infrastructure to get the most out of AWS cloud computing.
Diagnose network issues by continuously tracking the availability, performance, and cost of your AWS cloud applications. Show AWS alarms and performance metrics in real time. Visualize monitoring data in clear graphs and dashboards to identify problems more easily. Gain the overview you need to troubleshoot all kinds of issues with your cloud computing infrastructure as well as your entire network.
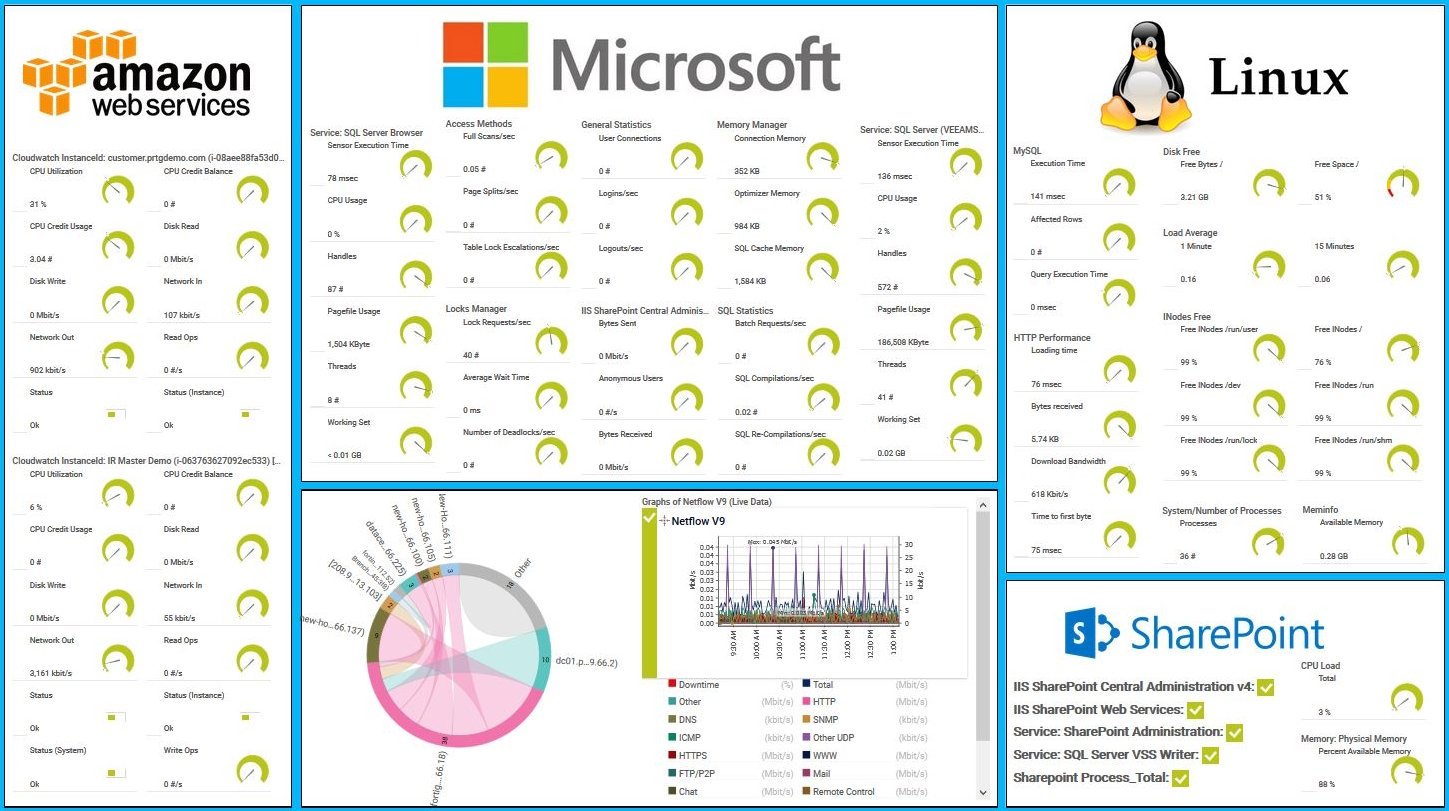
AWS, Linux and Windows services overview in PRTG

Device tree view of the complete monitoring setup

Custom PRTG dashboard for keeping an eye on the entire IT infrastructure

Live traffic data graph in PRTG
“All-around winning
network monitor”
“The real beauty of PRTG is the endless possibilities it offers”
“PRTG Network Monitor
is very hard to beat”
PRTG works with Amazon CloudWatch to monitor the instances of: Amazon EC2, RDS databases, Amazon EBS data carriers, ElastiCache, and Elastic Load Balancing. SQS and SNS data is also retrieved, and the configured alarms are monitored.
PRTG extracts the CloudWatch data via AWS API calls, enabling you to link it to other monitoring data such as the router status. As a result, you'll be able to identify correlations while troubleshooting that might not show up when only using CloudWatch.
PRTG comes with more than 250 native sensor types for monitoring your entire on-premises, cloud, and hybrid cloud environment out of the box. Check out some examples below!
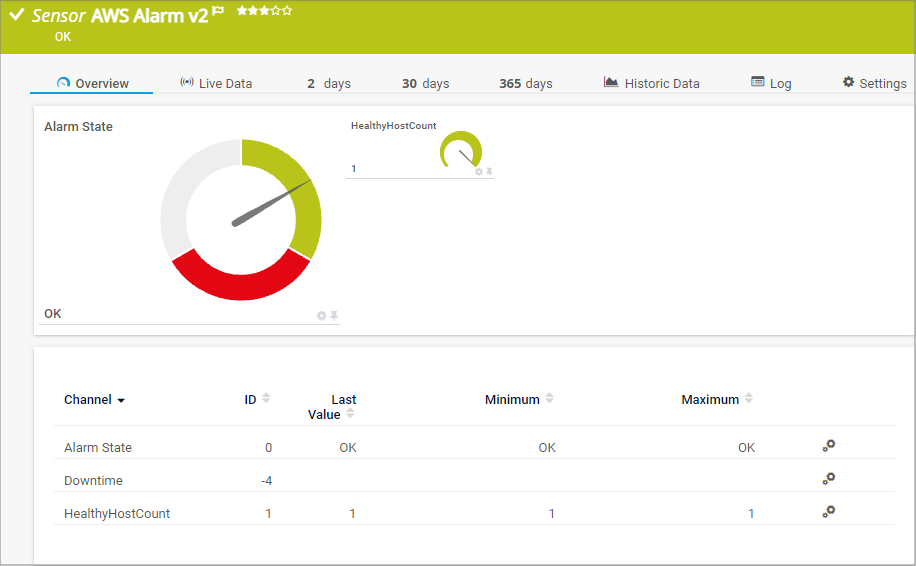
The AWS Alarm v2 sensor monitors the status of an Amazon Web Services (AWS) alarm by reading its data from Amazon CloudWatch via the AWS API. It can show the following:
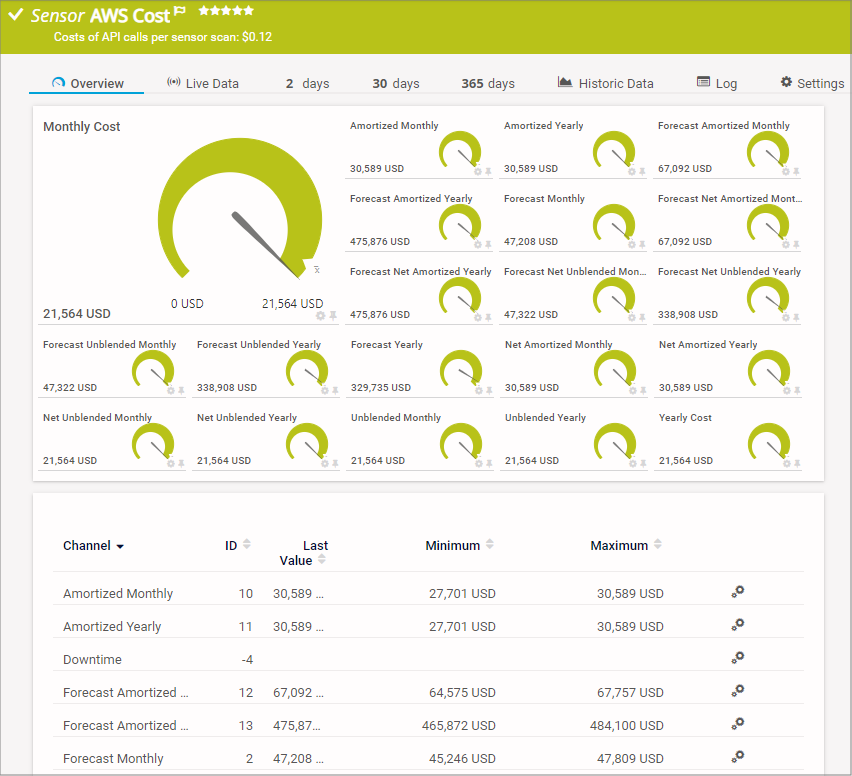
The AWS Cost sensor monitors the cost of an Amazon Web Services (AWS) account by reading its data from the AWS Cost Explorer API. It can show the following:
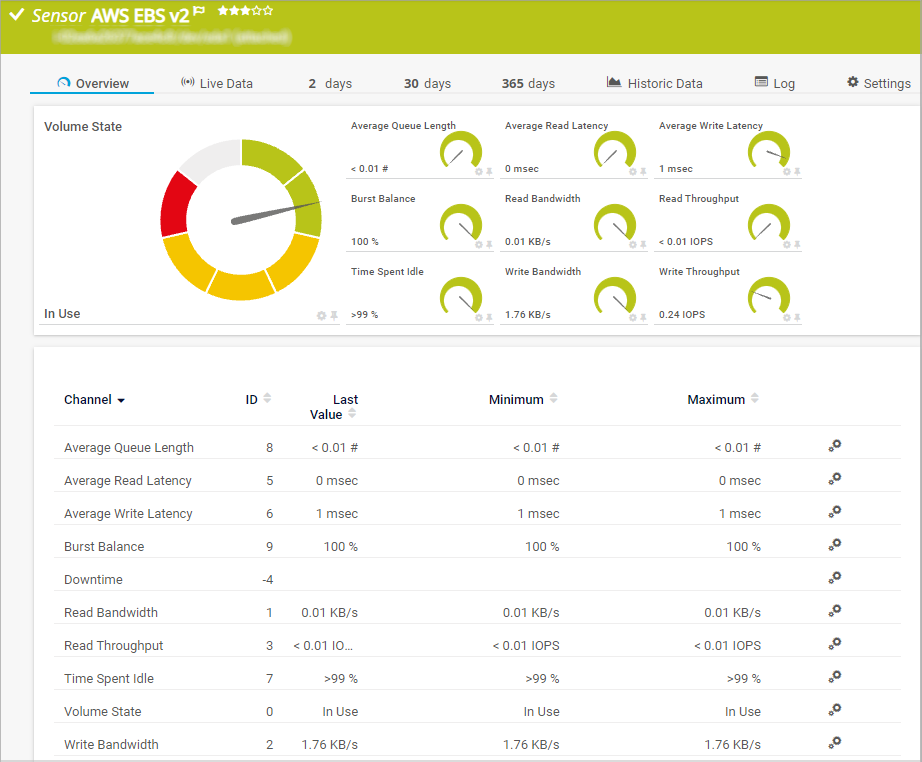
The AWS EBS v2 sensor monitors the performance of an Amazon Web Services (AWS) Elastic Block Store (EBS) volume by reading its data from Amazon CloudWatch via the AWS API. It can show the following:
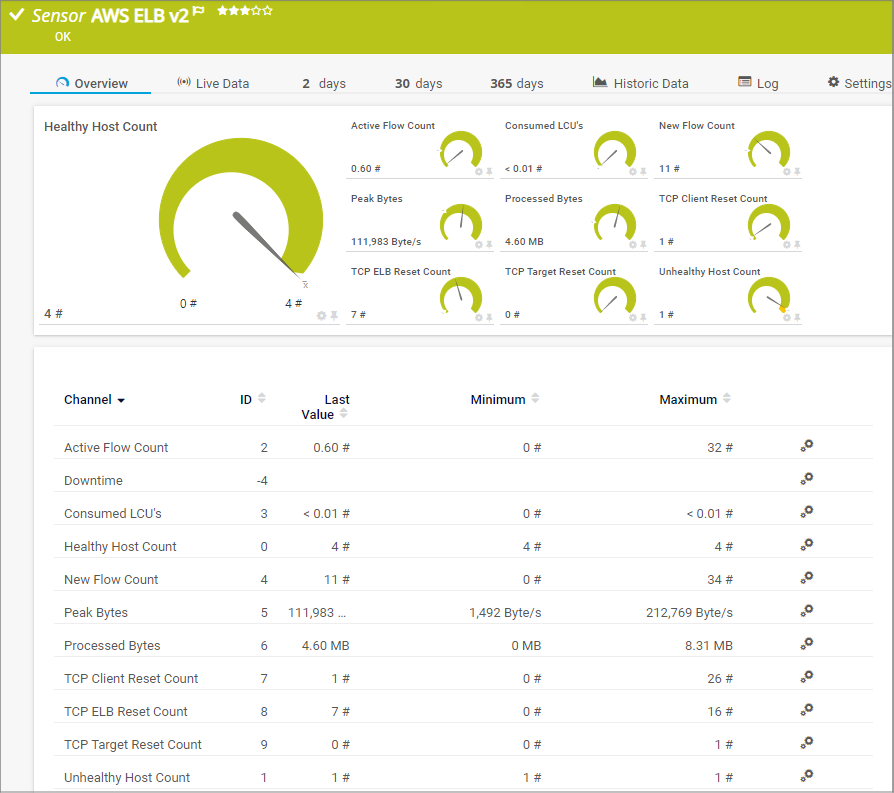
The AWS ELB v2 sensor monitors the performance of an Amazon Web Services (AWS) Elastic Load Balancing (ELB) load balancer by reading its data from Amazon CloudWatch via the AWS API. It can show the following and more:
See the PRTG Manual for a list of all available sensor types.

Real-time notifications mean faster troubleshooting so that you can act before more serious issues occur.
PRTG is set up in a matter of minutes and can be used on a wide variety of mobile devices.

Paessler is a certified partner in the Amazon Web Services ecosystem, which includes a growing community of software vendors who are building solutions on cloud computing.
What does this mean for you?
Partnering with innovative IT vendors, Paessler unleashes synergies to create
new and additional benefits for joined customers.
Combining their tools to a powerful solution for advanced analysis and automation, KnowledgeRiver and Paessler enable IT teams to ensure best performance for their infrastructure and networks.
Paessler is member of the mioty alliance, composed of companies that use mioty to create innovative IoT and IIoT solutions such as the retrofitting of industrial environments.
Combine the functionality of Sigfox and Paessler for the most comprehensive, cost-effective, and easy-to-use IoT solution available.
Custom alerts and data visualization let you quickly identify and prevent AWS service performance issues.
Network Monitoring Software – Version 25.3.110.1313 (August 27, 2025)
Download for Windows and cloud-based version PRTG Hosted Monitor available
English, German, Spanish, French, Portuguese, Dutch, Russian, Japanese, and Simplified Chinese
Network devices, bandwidth, servers, applications, virtual environments, remote systems, IoT, and more
Choose the PRTG Network Monitor subscription that's best for you


Amazon CloudWatch is the monitoring service for AWS cloud resources that allows you to collect and analyze data, configurations, and metrics from Amazon cloud platforms. PRTG connects to the Amazon CloudWatch API and uses CloudWatch data to monitor Amazon Web Services.
AWS monitoring involves tracking and managing the performance, health, and availability of AWS resources and applications. It uses tools like Amazon CloudWatch and Paessler PRTG to collect and analyze metrics, logs, and events. Monitoring helps identify and resolve issues, optimize performance, and ensure the reliability of services. Alerts can be configured to notify administrators of potential problems. Overall, it ensures that AWS environments run efficiently and effectively.
PRTG comes with a variety of built-in AWS sensors which allow for Amazon CloudWatch data to be effortlessly integrated into your monitoring solution. These sensors have been developed for a number of services that are monitored by CloudWatch, for example, AWS EC2, AWS EBS, AWS ELB, and AWS RDS. What’s more: PRTG lets you receive AWS Alarms centrally and also checks the costs that come with using Amazon Web Services.
AWS Alarms
In CloudWatch, you can set custom alarms for a variety of metrics, and receive notifications or define actions to be executed automatically in the event of an alarm, such as auto-scaling during EC2 instances. PRTG lets you integrate these alarms into your central monitoring, and therefore group all the data from your IT infrastructure into one place. Furthermore, thanks to free alerts of PRTG (e.g. push notifications), you’ll always stay in the know.
Amazon EC2
Amazon Elastic Compute Cloud (Amazon EC2) provides virtual servers for web-based computing with an elastic configuration. Choose from a variety of instance types, operating systems, and software packages, then create your own custom configuration based on RAM, CPU, instance memory, and boot volume size. A quick adjustment of capacities and you’ll be well prepared for fluctuations and load peaks. Within minutes, you can increase or reduce the capacity of your hosting, and thereby gain total control.
Amazon EBS
Amazon Elastic Block Store (Amazon EBS) is a service for Amazon EC2 instances. Volumes for persistent block storage ensure a high level of availability and protection in the event individual components break down. Amazon EBS volumes provide for consistently high performance and short latency. Use them to manage computer processing loads. The advantage of Amazon EBS: You can increase or reduce capacities within minutes.
Amazon ELB
The function of Amazon Elastic Load Balancing (Amazon ELB) is to automatically distribute incoming application traffic across several EC2 instances. The load distribution capacity that is required for this function adjusts seamlessly to the distribution of the application data. As a result, your network load is stabler and your applications are granted more room for error.
Amazon RDS
The Amazon Relational Database Service (Amazon RDS) helps you tailor the configuration, administration, and scaling of a relational database in Amazon cloud computing. It also allows for the automation of administrative tasks, such as hardware provisioning, database setup, and importing backups and patches.
In PRTG, “sensors” are the basic monitoring elements. One sensor usually monitors one measured value in your network, for example the traffic of a switch port, the CPU load of a server, or the free space on a disk drive. On average, you need about 5-10 sensors per device or one sensor per switch port.
Paessler conducted trials in over 600 IT departments worldwide to tune its network monitoring software closer to the needs of sysadmins. The result of the survey: over 95% of the participants would recommend PRTG – or already have.

Paessler PRTG is used by companies of all sizes. Sysadmins love PRTG because it makes their job a whole lot easier.
Bandwidth, servers, virtual environments, websites, VoIP services – PRTG keeps an eye on your entire network.
Everyone has different monitoring needs. That’s why we let you try PRTG for free.